Quantcast
Channel: Syncfusion Blogs
Viewing all 473 articles
Browse latest View live

A Peek into TypeScript Succinctly

$
0
0

TypeScript is a rising star, offering web developers the static typing missing from JavaScript, but still fully compatible with it. Whether you’re familiar with JavaScript already, or you want an easier gateway to it first, TypeScript is an excellent choice for languages to learn. As usual, Syncfusion can get you up and running with the Succinctly series.

In TypeScript Succinctly by Steve Fenton, you will learn about TypeScript’s optional static typing and classes for JavaScript development, how to create and load modules, and how to work with existing JavaScript libraries through ambient declarations. TypeScript is even significantly integrated with Visual Studio to provide the autocompletion and type checking you are most comfortable with.

Some of what’s covered in only 82 pages:

  • TypeScript Concepts: Code Organization, Glossary, Compilation
  • Visual Studio Extensions
  • Type Safety
  • Creating New Modules
  • Loading Modules
  • How to Work with Existing JavaScript
  • Unit Testing with TypeScript

A glimpse inside this ebook:

Chapter 1

Concepts in TypeScript

Code organization I will begin by drawing some parallels between .NET and TypeScript in respect to code organization and language features. In some cases, the conventions are nearly identical, but there are also some interesting differences in both the naming conventions and the meaning of the various components used to compose your application.

Figure 1 demonstrates the structure of a TypeScript program, which is organized into a number of modules, each containing interfaces, classes, and variables. Each module should group related classes together and should have minimal dependencies on other modules in your program. Although you can create multidirectional dependencies and circular dependencies in TypeScript, I recommend that you avoid doing so, as it will make your program harder to maintain.

This program structure allows you to put your object-oriented programming skills into practice and makes it easy to use common design patterns to organize your program.

I will use the TypeScript naming conventions throughout this book, but feel free to read method when I use the term function, for example, if that is what you are more used to.

TypeScript glossary

Program

A TypeScript program is a collection of source files. Most of these source files will contain your code implementation, but they can also contain declarations that add static types to external code. I will talk about writing you own code in Chapter 4, “Creating new modules,” and consuming existing code and third-party libraries in Chapter 6, “Working with existing JavaScript.”

You can think of your program as both the TypeScript .ts files and the compiled JavaScript .js files. Module TypeScript modules are similar to .NET namespaces, and can contain a number of classes and interfaces. The structure of your modules can vary from very flat structures to highly nested ones depending on the kind of program you are writing.

Interface

Interfaces in TypeScript work exactly like .NET interfaces, allowing the development tools and the compiler to emit errors if a class fails to implement an interface correctly. Because the interface exists solely for the benefit of the design-time tools and the compiler, no JavaScript code is generated from a TypeScript interface. A TypeScript interface can extend multiple interfaces.

Class

A TypeScript class is similar to a .NET class and can contain functions and variables with varying levels of visibility. In TypeScript you can use public and private visibility keywords on functions and variables.

A TypeScript class can extend one class and implement multiple interfaces.

Function

A TypeScript function is like a .NET method, accepting arguments and returning a typed value or void. This is where the real logic will live in your program.

Variable

In TypeScript all properties and fields are variables, but with optional typing. By default, these variables behave in a similar manner to those declared in .NET using the var keyword, as the compiler will attempt to infer the type and then treat the variable as statically typed. In cases where the type cannot be inferred, the compiler doesn’t show an error as it would in .NET, but instead treats the variable as a dynamic type, which in TypeScript is indicated with the any keyword. I will discuss this in more detail in Chapter 3, “Type safety.”

Enumeration

Enumerations in TypeScript are similar to .NET enumerations. The experimental implementation in version 0.8 of TypeScript has been amended slightly in version 0.9.

Scope

Because functions, classes, and modules are compiled into various flavors of JavaScript functions, everything nested within them is locally scoped, and will enjoy the benefits of JavaScript’s lexical scoping. This means a nested function has access to its own variables and also the variables in the outer function. If no variable exists in the local scope, the JavaScript runtime walks up the chain to find the variable in the outer function, and if no variable exists there, it continues to the next level. This continues right up until JavaScript checks the global scope.

Compilation

TypeScript is converted into JavaScript at compile time. JavaScript is an implementation of the ECMAScript standard, and it isn’t the only one–ActionScript is another well-known language based on the ECMAScript standard. There are three versions of ECMAScript that you will come across when dealing with TypeScript.

ECMAScript 3

ECMAScript 3 was published in 1999, and it is the version supported in most browsers. When TypeScript compiles into JavaScript, it uses the ECMAScript 3 standard by default. A very small number of features are unavailable in TypeScript when targeting ECMAScript 3, such as property getters and setters, but it offers the widest possible support for your program.

If you try to use a feature that isn’t available in the version of ECMAScript you are targeting, the compiler will warn you to either avoid the feature or change the target version. I have included instructions on how to target ECMAScript 5 in Chapter 2, “Visual Studio.”

ECMAScript 5

ECMAScript 5 was published in 2009 and is supported in all modern browsers. You can instruct the TypeScript compiler to target ECMAScript 5, which makes additional language features available, but your program may encounter problems in older browsers. The following browsers support all of the important features of ECMAScript 5; older versions of these browsers have only partial support:

  • Internet Explorer 9 and above.
  • Firefox 4 and above.
  • Opera 12 and above.
  • Safari 5.1 and above.
  • Chrome 7 and above.

ECMAScript 6

ECMAScript 6, also known as ECMAScript Harmony, is currently being drafted and has experimental support in some of the latest browsers. This version is interesting, because it will make modules and classes part of the JavaScript language. TypeScript gives you immediate access to these proposed new features in practically all browsers. At some point in the future you will be able to target the ECMAScript 6 standard from TypeScript, which will mean the compiled JavaScript will more closely match your TypeScript code.

There is currently no release date planned for ECMAScript 6, and it doesn’t support all of the concepts in the TypeScript language.

TypeScript life cycle

The TypeScript life cycle consists of three distinct stages. When you are writing TypeScript code, you are participating in the design time stage along with any development tools you are using. The compiler represents the second stage, converting TypeScript into JavaScript, and raising errors and warnings it discovers. The final stage involves the runtime executing the generated JavaScript.

To continue reading TypeScript Succinctly, download it from our Succinctly library.

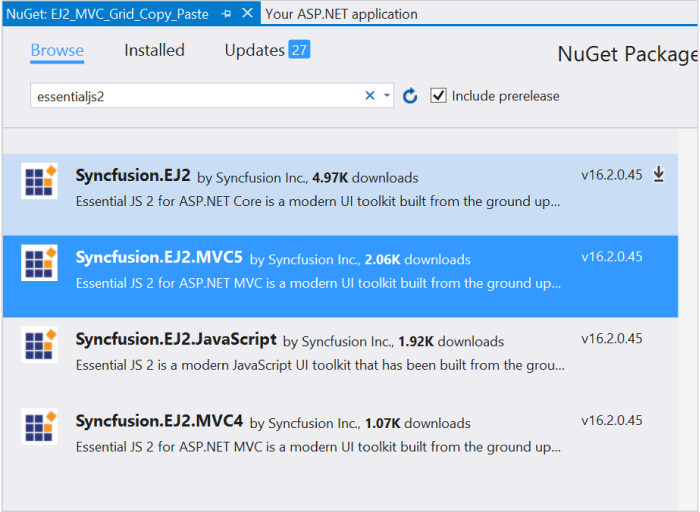
If you read this ebook and want to see or play with some TypeScript controls, check out Syncfusion’s Essential JS 2 suite, with over 50 components written in TypeScript and compiled in JavaScript. You can download them with a 30-day trial or a Community License, if you qualify.

Have you read TypeScript Succinctly or worked with our Essential JS 2 controls? Are you a fan of TypeScript? Let us know what you think in the comments below or on Facebook or Twitter.

If you like this blog post, we think you’ll also like the following free e-books:

JavaScript Succinctly
TypeScript Succinctly
AngularJS Succinctly
Angular 2 Succinctly


How to Create a Dashboard: Master Guide from Setup to Deployment

$
0
0

As any of you who frequent our blog may have noticed, we are super enthusiastic about our Dashboard Platform and helping you use these business intelligence tools to their full advantage. We have even more how-to blogs than we realized! However, it’s kind of a pain to scroll back in time to see if we might have that one blog post you’re looking for. So, we’ve compiled a list of our related blog posts for your easier perusal.

Bookmark this blog! We’ll continue to update it with future posts and tutorials.


Getting Started with the Dashboard Platform:

Setting up the Server the First Time

How-to Sample: Installation and Configuration

How-to Sample: Creating a Simple Dashboard

How to: Setting Up the Server in Azure

How-to: Navigate the Designer Interface


Managing Dashboard Data:

How-to: Connecting to Data and Transforming It

Using the Data Integration Platform to Create a Dashboard Platform Data Source


Creating and Using Dashboard Filters:

How-to: Working with Filters

Filter Panel

Filtering Data Based on User


Viewing and Sharing:

Monitoring Dashboards on the Go!

Raw Data View

How-To: Share Dashboards

How-To: Working with Images


Advanced Features:

How-To: Working with Multi-Tabbed Dashboards

How to Deal with Errors

Embedding a Dashboard in a Webpage

Grid: Setup, Customization, Conditional Formatting, and KPIs

How-To: Working with Parameters

How-To: Configuring Data Notifications

Live Twitter Feeds

Rebranding

Configuring Single Sign On (SSO)


Would you like to see any particular how-to blogs for our business intelligence tools? Let us know in the comments below.

Alexa Could Understand Sign Language: Developing an Accessible World

$
0
0

When it comes to technology’s latest and greatest, major developers and freelancers alike are striving to give access to as many people as possible. In cool news this summer, developer Abhishek Singh has created a prototype mod for Amazon’s Alexa that allows it to understand sign language.

In an interview with The Verge, Singh pointed out that voice-based devices like Alexa are prevalent and growing in importance. But while this is great for visually impaired people, it doesn’t help the auditorily impaired access such personal assistants. “Seamless design needs to be inclusive in nature,” he said to his interviewer. So he designed a system that deciphers sign language by hooking an Amazon Echo up to a laptop with a webcam and using back-end machine learning software. The program was able to decipher the gestures it was taught, meaning it could learn full sign languages.


Amazon Echo

Amazon is already dipping into making Alexa more accessible, though it hasn’t gotten to the auditorily impaired community. The Echo Show now allows you to activate Alexa using the touchscreen instead of your voice. It’s also expanding captioning options to several more countries.

Google, too, is working hard on improving accessibility to people with impairments. It has a team entirely dedicated to testing new products and UIs for accessibility, and lately that team has been expanding its reach to improve the lives of impaired people. This year, Google Maps released a new route type, wheelchair accessible, for public transportation directions. People with mobility issues can now easily figure out which stations and routes are viable for wheelchairs, walkers, crutches, and strollers in cities.

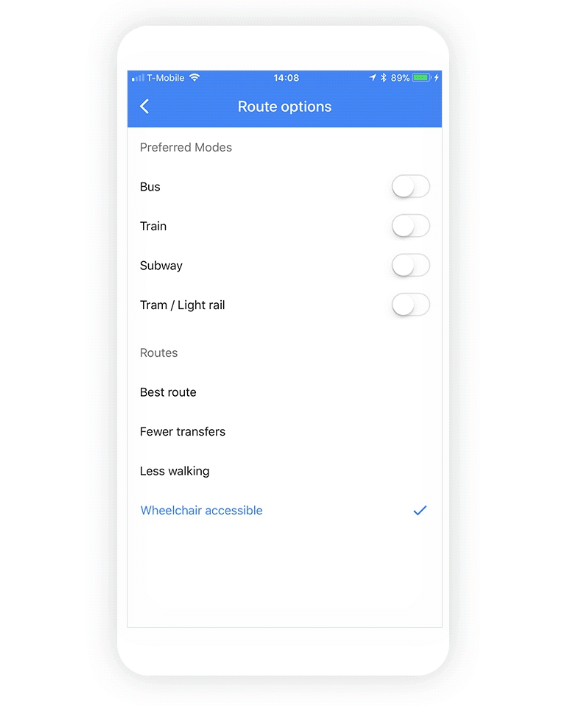
Wheelchair accessibility option in Google Maps (image:
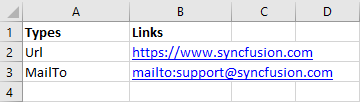
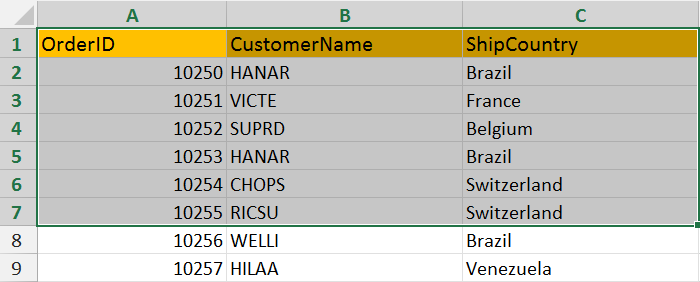
 The Android Soul)

Google has also produced the Lookout app for smartphones that audibly describes what is visible in its camera range to give visually impaired users a better idea of what’s around them. It also offers a free, online course on developing apps with accessibility in mind.

Syncfusion is also careful to build accessibility options into our products. Many of our controls work with on-screen readers and assistive technology, providing text that can replace images and animations, for example. UI element visuals are based on WCAG 2.0 standards, and many controls conform to W3C’s WAI-ARIA (Web Accessiility Initiative–Accessible Rich Internet Applications) standards and recommendations for best practices. Most controls are also Section 508 compliant, fully supporting accessibility features like clearly indicating where the focus is in interactive interface elements.

A dark theme in Syncfusion’s pivot client control for ASP.NET Core

Recently, a customer with a Community License was so pleased with Syncfusion’s accessibility options that he kindly wrote a customer story for us. Josep Balague is making an app to help give visually impaired people more independence over managing their finances. He found one of our dark themes helpful in giving his UI high contrast, which is easier for visually impaired people to read, and appreciated the OCR capabilities of our WPF controls.

Syncfusion is happy to be a part of Balague’s project, but we also know there’s always room for improvement. Have you noticed one of our controls lacking an accessibility feature you think would be useful? Do you have a suggestion for improving the accessibility of our controls or website? Or have you read about really cool accessibility improvements somewhere else recently? Let us know in the comments below or on Facebook or Twitter.

Interview with Public Speaking for Geeks Succinctly Author Lorenzo Barbieri

$
0
0

The following is a short interview with Succinctly series author Lorenzo Barbieri, whose book Public Speaking for Geeks Succinctly was published in July. You can download the book from the Succinctly library.

What should people know about public speaking? Why is it important?

Public speaking isn’t limited to delivering sessions or talks at conferences, user groups, or meet-ups. Public speaking skills are necessary also during team meetings, customer meetings, even during one-to-one meetings with your boss or when talking with a recruiter. Being a good public speaker isn’t reserved to people with the “right gene;” it’s a skill that one can learn, exercise, and master. Public speaking is not reserved only to extroverted people; introverts can master it, too.


When did you first become interested in public speaking?

When I met some great speakers during the first conferences that I attended fifteen years ago, like Don Box, Clemens Vasters, David Chappell, and especially Rafal Lukawiecki. Then I started to follow the best speakers that I could find at every conference, trying to learn from them. I’ve read many books and seen a lot of videos. And, of course, I started delivering sessions at user groups meetings, and then at small and big conferences, speaking in front of a thousand people, or online with many thousand viewers.


By writing this ebook, did you learn anything new yourself?

This ebook is based on a one-day course that I delivered in the last year, but writing the book helped me better explore some topics that were barely mentioned during the course, like working with tools like PowerPoint and Keynote. I also spent some time trying to create meaningful examples to show how to design better slides.


How will public speaking change over the next few years?

More and more will focus on online delivery, even when talking at a conference. For example, slides with online-only content for people who have time to experience it at home or in the office, not being constrained only to the time during the talk. There will also be better support for people with disabilities and people who speak a different language, through the power of AI.


Do you see public speaking as part of a larger trend in software development?

In my view, being a successful software developer requires many soft skills, and public speaking is one of them. Perhaps one could be the star of a small team, but to shine one should be able to present his or her ideas to a broader audience, even internally at the company or during meetings with customers and partners.


What other books or resources on public speaking do you recommend?

There are so many resources, like James Whittaker’s books about storytelling and creativity, the official TED Guide to Public Speaking by Chris Anderson, Confessions of a Public Speaker by Scott Berkun, and so on. There are many TED Talks about public speaking, but a video that I’d like to share is “How to Rock the Stage!

Introducing JavaScript Pivot Grid (Pivot Table) Component for Web Apps

$
0
0

Typically, user scenarios with transactions, sales, employees, warehouse details, etc., are maintained as flat data in a table. These entries will have lot of raw data and it will be very difficult to analyze them. Taking this into consideration, our pivot grid widget has been developed to automatically summarize raw data and group it. It also allows the user to manipulate the data in different ways (sorting, filtering, calculated fields, etc.) and get the reports changed dynamically at runtime.

With the introduction of Essential JS 2 pivot grid, users will be able to append a HTML5 multidimensional data visualization component into their web-based application. Pivot grid is an interactive widget that works on top of the relational data source, presenting a rich UI and high-performance pivot engine to aggregate and analyze the raw data in a meaningful and grouped manner. To add the pivot grid to your app easily, you can refer to our documentation.

In this blog, we are going to walk you through the most important details of the pivot grid. We will be looking at the following sections one by one:

  • Possible UI settings to create and alter reports dynamically at runtime.
  • Creating new fields based on existing measures and simple arithmetic formulas.
  • Key features of pivot grid.
  • What’s coming next in Essential Studio v16.4.

User interaction

The main motive of the UI interface is to provide a good user experience. Users anticipate the interface will be easy to access, be easy to understand, fulfill their needs, and have a pleasant aesthetic appearance. Our pivot grid will satisfy these through the pivot field list and grouping bar features.

Field list

Field list is similar to a schema designer for your raw data from the data source. It allows you to manage and customize the pivot reports at runtime. The following report manipulations can be performed through the field list UI.

Create: Users can create reports by simply dragging an unbound field from a field list across the four axes and get the view instantly in pivot grid.

Customize: Users can customize an existing report by simply dragging the field (either unbound or bound) across the four axes. Also, users can rearrange the order of the bound fields within the same axis.

Deletion: Fields can be removed either by dragging the field outside the axes or by unchecking the bound item from the field list.

Filtering and sorting: Filter and sort icons are placed inside the pivot button. They allow users to remove records based on a condition and order them. On performing any such operation, the icon also changes, indicating its current state.

To learn more about field list, refer to our documentation.

PivotTable Field List

Grouping bar

Grouping bar gets displayed at the top of the pivot grid as a panel and its main scope is to customize the report with the bound fields alone. No new report can be created using grouping bar. It allows you to drag fields between different axes, such as columns, rows, values, and filters, and change pivot views at runtime. The below report manipulations could be performed.

Customize: Allows the user to customize an existing report by dragging a bound field across the four axes. Also, the user can rearrange the order of the bound fields within the same axis.

Deletion: Fields can be removed by dragging them outside the axes.

Filtering and sorting: Filter and sort icons are placed inside the pivot button. They allow users to remove records based on conditions and order them. On performing any such operation, the icon also changes, indicating its current state.

To learn more about grouping bar, refer to our documentation.

Grouping Bar (aka, Group Fields)

Calculated field list

 A user-defined value field can be created and added based on a simple mathematical formula and other value fields. For example, assume that you have information on the total sales amount and discount amount of the products in a store. Now, if you want to display information about the discount percentage of each product, a new, user-defined field should be created. The actual formula to calculate a discount rate is:

Discount amount / (Sales amount + discount amount) * 100

To achieve this case practically, in the calculated field UI, simply drag the fields, total sales amount and discount amount, into the formula bar, prepare an arithmetic expression, and execute as shown in the following image.

“Sum(discount_amt)”/(“Sum(sales_amt)”+ “Sum(discount_amt)”)*100

To learn more about calculated fields, refer to our documentation.

Calculated (aka, user-defined) Field

Key features

Filtering

Filtering is one of the most important features. It slices the member in order to get precise information that the user is looking for quickly. In other words, filtering allows you to view pivot grid with particular records based on filter criteria. It can be configured using the filterSettings option through code behind. Also, the field list and grouping bar UI has this functionality built in, allowing users to apply filter criteria at runtime. To learn more about filtering, refer to our documentation.

Filtering members in Pivot widget

Sorting

Yet another important feature is sorting. Sorting allows users to order the field header in rows and columns, either in ascending or descending order. By default, the sorting option is enabled in pivot grid, allowing field headers to be arranged in ascending order. Users can disable sorting by setting the enableSorting property to false. Sorting can be applied either through code behind or UI options like field list and grouping bar. To learn more about sorting, refer to our documentation.

Sorting members in Pivot widget

Aggregation

Sometimes users may need different aggregation types, like minimum, maximum, average, and count, instead of summing the values by default. For example, they may need the maximum selling quantity and minimum price. In such a case, calculations are performed over a group of values using the aggregation option and its resultant data is bound to the pivot grid. This option needs be defined through the report in code behind. To learn more about aggregation, refer to our documentation.

Exporting

At the end of an analysis, if the user wants the data to be saved for later use or wishes to send it to other users, exporting seems to be the best practice. The exporting option is an essential feature for any analytics tool. The pivot grid provides exporting support for Excel, PDF, and CSV file formats, along with customization options. Please check out the documentation for Excel and PDF.

What’s coming next?

We are planning to provide the following features in our Volume 3 release.

Virtual scrolling

The pivot grid will provide a great experience with the virtual scrolling option. It will load large amounts of data without any performance problem, with a smooth scrolling experience. Technically, data will be generated only for the view area alone. When a user scrolls, either vertically or horizontally, the event will trigger to get the new data and update the pivot grid view dynamically.

Excel-like labels and value filters

We are also planning to provide label and value filters, to expand the filter options, and improve the analysis results bound to the pivot grid view, inspired by Microsoft Excel. On applying a label filter, the pivot grid view excludes the display of members from that filtered-out field. With value filters, aggregated values across the bound field, meeting the criteria/range would be displayed excluding the rest.

Conclusion

If you are an existing customer, please download the new version of Essential JS 2 from the download page and try the new widget and its features for yourself. If you are a new customer, you can try our 30-day free trial to check out this new widget.

If you have any questions or require clarification, please let us know in the comments section below. You can also contact us through our support forum or Direct-Trac.


Top Programming Languages to Learn in 2018

$
0
0

With the technology landscape changing as fast as it does, programming languages have a tendency to rise and fall quickly. However, there are those that have stood the test of time, and those that show definite signs of gaining momentum for years to come. We have put together a list of languages we think are the most useful to learn in today’s job market.


Java

Java lands steadily in the tried-and-true category and is number one on many lists because of its high employability. In 2017, it was the most in-demand language on job boards like Indeed, being a popular language with many Fortune 500 companies. Therefore, it’s still the reigning champion of languages to learn, particularly for employment. Let us help you get started with our free ebooks, Java Succinctly Part 1 and Java Succinctly Part 2.


SQL

Ok, so it’s a querying language, but we’re slipping SQL in here because it’s more in demand than even Java. Hadoop and other newcomers are popular, but SQL is everywhere and in seemingly everything, with most tech (and other) companies using it in some way. In a data-driven world, SQL is a good aspect to understand. Our Succinctly series has you covered with SQL Server for C# Developers and SQL Queries Succinctly.


JavaScript

Unsurprisingly, JavaScript is still near the top. Commerce relies more and more heavily on operating through websites, making JavaScript heavily in demand. GitHub ranks it number one in popularity among its users, and in Stack Overflow’s list of most popular frameworks, three of the top four are based on JavaScript. If your skill with JavaScript is only passing or approaching intermediate,  JavaScript Succinctly is a good way to solidify your understanding.


Python

While Java may still be prom king, anyone watching can see that Python is gaining in popularity faster than any other language. In the TIOBE Index, it’s surpassed C# this year. This high-level, readable, and versatile language is used by some of tech’s major players and is beloved by many. Our Python Succinctly ebook will take even a complete beginner to mastery of this language.


TypeScript

As we’ve mentioned, JavaScript is here for the long haul, and TypeScript is JavaScript with a facelift. With its static typing smoothing over one of JavaScript’s most bemoaned flaws, it’s easier to read and write. TypeScript’s popularity is soaring and leading frameworks like React and Angular are now using it. Learning it can be easier for newcomers than learning JavaScript itself. Get started with our free ebook, TypeScript Succinctly.


Go

Created and backed by Google, the Go language is becoming more popular for building system software. It’s also considered easy to understand and efficient (it would have to be, to power the Google search engine), with a growing user base. Docker and Kubernetes are also built using Go, and the language is proving useful to the development of microservice architectures and data science. Whether you’re new or experienced with Go, Go Succinctly and Go Web Development Succinctly will have you coding fluently in no time.


Scala

If TypeScript was meant to fix JavaScript’s more irritating qualities, then Scala patches up the same in Java. Although a bit complex, it’s a flexible and (as the name suggests) scalable alternative that’s been around and popular long enough to have a lot of support from the community. While nowhere near as widespread as Java itself, Scala is slowly trending up and offers well-paying jobs, especially for data science and companies like Twitter, who simply outgrow the language they started with. From learning the basics to syntax shorthand, Scala Succinctly will have you up and running with the language quickly.


PHP

Although there was speculation of its demise a while ago, PHP has not only held on as a preferred server-side web development language, but has been rising in the ranks of popularity on charts like the TIOBE Index all summer, surpassing JavaScript in growth. Learn this straightforward scripting language in 119 pages with PHP Succinctly.


C++

Complex, but with high performance and community support, C++ remains a popular universal language for building desktop apps and video games. Ranked #6 on GitHub’s popularity chart (by number of pull requests) and #3 on the TIOBE Index, this is a good language to learn for programs with performance-intensive tasks. Get the basics down with our free ebook, C++ Succinctly.


C#

Higher level than C++, C# is good for building Microsoft apps and indie computer games, and seems to be the way VR is going, since it’s what Unity uses. It can be used on any platform, thanks to Xamarin. Its popularity has remained steady for a while now and, though you can build apps for Linux and Mac with it, it’s the best language to learn if you need to build anything .NET. Learn the syntax you need to build your own applications in C# Succinctly.


The Syncfusion Succinctly series is a quick way to learn new programming languages from experts who use them every day. Take advantage of these free resources to increase your repertoire and stay relevant in this ever-changing industry. If you pick up C#, JavaScript, or TypeScript, feel free to download the free, 30-day trial of Syncfusion’s Essential Studio Enterprise Edition to play around with some controls built in those languages. Let us know what you think will trend up or down, or remain steadily popular for the rest of the year in the comments below, or on Facebook or Twitter.

Develop Xamarin Apps to Monitor Device Internals Webinar Q&A

$
0
0

On August 23, 2018, Syncfusion hosted the webinar, “Develop Xamarin Apps to Monitor Device Internals,” presented by Chad Church, Syncfusion’s product manager. He took attendees through how to monitor the accelerometer, WiFi, and Bluetooth capabilities of their apps. The following blog post is the Q&A portion of the webinar. The webinar recording can be found on our YouTube page, or you can watch it here.


Q: Dear Chad, thanks for the video. I have been trying to use Xamarin.Essentials in a sample app, but always get Android related-errors. How can I solve this?

A: It depends on the errors you get. There is a troubleshooting page in Xamarin docs. Please look at it.

https://docs.microsoft.com/en-us/xamarin/essentials/troubleshooting


Q: Do you have a university or an online course that can teach us how to create new controls for Xamarin? I would really love to learn how you create these controls.

A: We do not have an online course that teaches you how to create custom controls. The best place to learn is the Xamarin.Forms source itself to see how the framework controls are made.

https://github.com/xamarin/Xamarin.Forms

We also suggest you look at the XLabs source code in GitHub, which has some Xamarin components, or other open-source controls in GitHub.

https://github.com/XLabs/Xamarin-Forms-Labs

It is necessary to learn about custom renderers before looking at those source codes. Here are some of the links where you can study this.

https://docs.microsoft.com/en-us/xamarin/xamarin-forms/app-fundamentals/custom-renderer/

https://docs.microsoft.com/en-us/xamarin/xamarin-forms/creating-mobile-apps-xamarin-forms/summaries/chapter27


Q: When will an accordion control be available?

A: You can use SfListView as an alternative with expandable list view features.


Q: Can this sample be downloaded?

A: Yes. This sample can be downloaded from the following location:

https://github.com/syncfusion/xamarin-device-internals


Q: What are the prerequisites for the community license?

A: Companies and individuals with less than $1 million USD in annual gross revenue and 5 or fewer developers are eligible for the Syncfusion Community License.


Q: Do you know whether Syncfusion has any plans of developing plugins or utilities other than UI controls? For example, PCL File access.

A: As all the plugins are being included in Xamarin itself, we do not have immediate plans for developing plugins.


Q: It would be nice to have a timeline control. Is Syncfusion considering developing one in the near future?

A: We will make a note of it and add it to one of our future releases based on its priority.


Q: Do your controls have similar properties, etc., across platforms?

A: Yes. Mostly we have similar properties and functionalities.


Q: If I learn Xamarin, will I have a head start in learning Windows controls?

A: Yes. It will give you some head start. However, you may still have to learn platform-specific intrinsic. Also, look at this comparison.

https://docs.microsoft.com/en-us/xamarin/cross-platform/desktop/controls/

https://docs.microsoft.com/en-us/xamarin/cross-platform/desktop/controls/wpf

Where Talent and Opportunity Meet

$
0
0
Sneha Senthilkumar, Intern

On my first day at Syncfusion, I remember sitting in the lobby, anxiously waiting to see what this internship would bring me. With less than a week left, Syncfusion has given me an enlightening internship experience that exceeded all of my expectations.

For me, the most important aspect of an internship was gaining as much practical knowledge as I could and exercising my analytical and problem-solving skills in the IT field. Interning under Jaclyn Vidusic and Jessica Phillips has been a rewarding experience, and they have taught me skills that will be useful throughout my career. When designing projects for me to complete, they considered my goals for the summer and the knowledge and experience I hoped to gain from my internship. Every project I worked on this summer has helped me meet goals that I set before I walked in on my first day.

When I received my first project, I felt both excited and nervous. I was creating work that would actually have an impact on the company, and not many college freshmen get the opportunity to do that. I wrote regular expressions for the legal team to help sort through software licenses more efficiently and decide which software could be sold commercially. Additionally, I completed several Salesforce projects and observed technical support calls.

One of the key points of my internship learning experience was adjusting my mindset to think about problems from a business perspective. For example, when I began my Salesforce training, the only thing on my mind was solving the problem that was presented to me; if the team needed to learn how many licenses were sold last month, then finding that piece of information was my sole focus. However, when it came to projects where I had to pull reports and create dashboards, I was forced to think about the big picture. Who would be using the report? What kinds of information would be useful to them? How should the report be organized so that the most important pieces of data would be clearly displayed and easy to read? These projects benefitted me greatly by helping me to refine my own business sense and to analyze questions from viewpoints I had not previously considered.

The work, as meaningful and important as it was, was not the only thing that made my Syncfusion internship such a wonderful experience. In my time here, I have gotten to meet some amazing and inspiring people. My initial imposter syndrome was gone before the end of the first week, and I was able to settle in seamlessly due to Syncfusion’s welcoming environment. Everyone treated me like a valuable member of the team and made efforts to get to know me. With the software industry being male dominated, I was pleasantly surprised to see that I was working with an all-female team. Working on a team of like-minded, intelligent women was both inspiring and empowering.

The Syncfusion team values networking and facilitating positive relationships between their employees. From catered meals to stress management seminars, Syncfusion supports their employees, and that didn’t exclude an intern. Additionally, I received professional development training to prepare me for the future. For example, a team member sat down with me and gave me feedback on how to improve both my resume and LinkedIn profiles. She also gave me advice on how to conduct myself and navigate the workplace environment. I now feel more prepared for future classes, internships, and other professional development opportunities.

It was a pleasure to intern with Syncfusion this summer. The lessons I have learned will benefit me greatly in both my academic and professional careers, and I am truly thankful for everyone who made this such a positive experience.


Syncfusion Sponsors .NET Conf Viewing Parties

$
0
0

Syncfusion is sponsoring several regional .NET Conference Viewing Parties this month. The .NET Conference is a free live streaming event organized by Microsoft and features well-known speakers like Scott Hanselman, community director for the .NET Team. The live event will give developers an inside look at who is behind .NET development and highlight what’s new and what’s in the pipeline.

Live viewing parties will be held world-wide, facilitated by thousands of regional .NET development user groups.

We are sponsoring live events in Vancouver, Quebec, and Austin as well as several cities in India such as Bengaluru, Chennai, Mumbai, and Gurugram.Full sponsorships cover food and drinks for attendees. In Europe, we are partially sponsoring the Munich and Amsterdam events. Organizers for these regional events will provide each attendee with a code to obtain one free license for our Essential Studio for Xamarin.

For a full list of live viewing parties, please visit: https://www.dotnetconf.net/local-events.

TypeScript 3.1 Release Candidate Out for Microsoft Ignite

$
0
0

You may have noticed that we’re big fans of TypeScript here at Syncfusion. TypeScript 3.0 was released over the summer, with its new unknown data type and parameter lists as tuples types, which were lovely but not mind-blowing. TypeScript 3.1 is already on the way, though, with Microsoft having recently released it as a release candidate.

Microsoft is teasing TypeScript users with support for mappable tuple and array types using existing mapped types, like Partial. It’s also making it easier to migrate to TypeScript. The language’s traditional namespaces, Microsoft developers admit in their blog, haven’t “aged well.” They are specific to Typescript and don’t merge with declarations like var, let, or const, making migration quite difficult. TypeScript 3.1 has become “smarter” and fixes this difficulty. In particular, migrating an untyped React codebase kept hitting this snag, but this fix coupled with the support for JSX.LibraryManagedAttributes introduced in TypeScript 3.0 should give a great deal of relief to developers who have become frustrated with it in the past.

On the other side, now that TypeScript generates built-in declaration file libraries, in particular lib.d.ts, many vendor-specific types are gone, so declarations will have to be added locally for those who need them. Narrowing functions have also been changed so that errors may be thrown when the typeof foo === “function” type guard intersects with “relatively questionable” union types composed of {}, Object, or unconstrained generics.

TypeScript Succinctly

If you are considering trying out TypeScript, but you don’t know where to start, check out our free ebook on the topic, TypeScript Succinctly by Steve Fenton, which will have you developing with the language in 82 pages. If you’d like to play around with TypeScript controls, we have over 50 available in our Essential JS 2 suite. If you’re new to Syncfusion, you can test out these tools with our free, 30-day trial.

TypeScript 3.1 is set to be officially released at the end of September, likely during Microsoft Ignite this week. If you’re attending, we’d love to see you! Come visit product manager Chad Church at booth #235 to see what’s new in our offerings.

See you in Orlando. Source: Microsoft

What are you looking forward to in the future of TypeScript or our own Essential JS 2 controls? Is there something at Microsoft Ignite you’re especially excited about? Let us know in the comments below or on Facebook or Twitter.

Interview with Twitter Bootstrap 4 Succinctly Author Peter Shaw

$
0
0

The following is an in-depth interview with Succinctly series author Peter Shaw, whose book Twitter Bootstrap 4 Succinctly was published recently. You can download the book from the Succinctly library.

What should people know about Twitter Bootstrap 4? Why is it important?

People should know to read the book! Just kidding…

Bootstrap 4 drastically cuts down the time it takes to lay out a webpage, especially if you’re not design-oriented. Think about Windows Forms programs. Now imagine the state many of the layouts on the forms in those desktop apps might be in if Microsoft had not decided to put a snap-to-grid or control-positioning aids in Visual Studio.

Many developers, especially those who don’t regularly do web-based front-end coding, are really not all that great at design. We program. We write code. That’s our job. But to many of the people that we write code for, they don’t understand this. For them, it’s the visual aspect, it’s the way the application looks that matters. You might write the most elegant code in history, but an alignment that’s off by a couple of pixels will cause you months of misery with most product owners. BS4 helps you avoid that. It speeds up the visual process and allows you to prototype user interfaces much quicker without all the hassle.

When did you first become interested in Bootstrap?

The answer to this is in the introductory material in the first Bootstrap book I wrote. If memory serves me correct, I was using Foundation at the time, but its class names were very awkward to use and remember. Bootstrap came along and pow, it was like a breath of fresh air.

By writing Twitter Bootstrap 4 Succinctly, did you learn anything new yourself?

That depends on which perspective you look at things from. As you get on in years, you realize that the IT industry doesn’t really change that much, but it changes every day. What do I mean by this?  Well, the fundamentals are always going to be the same: it’s always about multiple languages; it’s always about creating the solution and not actually writing the code; it’s about being creative while still obeying physical engineering principles. So yes, there is always a new tool to add to your toolbox or a better way you can achieve a task.

Looking at it from the other direction though, no. Bootstrap 4, while a major leap forward, I learned about before I even started to write the book. I kept up with the many major changes in the project before it stabilized enough for me to be confident I could write the book’s material. In terms of Bootstrap and web development, no, I didn’t learn anything new.

How will Bootstrap change over the next few years?

That’s a hard one to answer to be perfectly honest. It’s one of, if not the most popular, front-end framework, so it’s not going to go away anytime soon. But given how long it took to get to version 4 and some of the reasons cited for that delay, I don’t think version 5 is going to be rushed out very quickly either.

BS4 has to follow web trends. It has no choice if it’s going to survive. But I think we are starting to see a bit of a plateau in new functionality that offers UI enhancements being added to the browser for now, and are instead seeing more functionality being added under the surface for things like device hardware and similar APIs.

Since BS4 is solely UI and graphics oriented, we’ll only see major leaps in its evolution if there are similar leaps in the mainstream browsers.

On the flip side though, Bootstrap’s community is hard at work as ever creating add-ons, plugins, color schemes, and even entire derivatives based on the core product for use in special cases.

If there is one thing that must change, however, I think it’s going to have to be Bootstrap getting divorced from jQuery. There’s so much of a greater push these days for vanilla JS code, and it’s getting harder and harder by the day to justify including a library like jQuery when it’s not really needed. In fact, I already know of one third-party version of Bootstrap that’s set out to do just this.

Do you see Bootstrap and other UI frameworks as part of a larger trend in software development?

That depends on what you mean by a larger trend. Remember, Bootstrap is a CSS framework as opposed to a general client framework. In fact, to be honest, this is something that really needs to be cleared up because there is so much misinformation about web UI these days, it’s starting to twist things substantially.

Let’s take Angular versus Vue as an example. You ask any modern-day web developer, especially the younger generation, and you’ll find arguments on both sides telling you that one is always better than the other. But the fact is, they are actually somewhat complementary. Angular is the only one of the two that can be classed as a full UI/application framework, whereas Vue only deals with rendering, and so still needs something else like Angular behind it to make it useable.

Bootstrap is no different. I’ve seen the discussions and arguments, with one side fighting in Bootstrap’s corner, and the other fighting for React, or whatever the contender happens to be.

When you look underneath the term UI framework, however, Bootstrap on its own is not a full framework. It’s designed to give you a head start on laying out your forms and pages in a sensible and consistent manner. To actually do anything else, you need to start adding other kits into the mix, my personal favorite being Aurelia.

If by a larger trend you mean building applications from building blocks and using the correct tools for the job in the correct places, then yes, it is, but software development has always been about that. If you mean people building stuff just because they can, then no, I don’t believe it is. When Bootstrap was first conceived, it set out to solve an actual problem that existed. It wasn’t a project by a bunch of devs who didn’t like the way things were, but by a professional team in a large company who most definitely had a specific agenda. Yes, it’s grown substantially since then, but it’s definitely not a toolkit for the sake of being a toolkit.

What were the biggest challenges you faced when learning how to use Bootstrap?

Pretty much the same as anything to do with web development: browser wars. Yes, even now in 2018, it’s still going on. Chrome trying to one-up Firefox, Firefox trying to one-up Microsoft, and Apple sitting in the corner ignoring everyone. It’s never going to stop, and as long as the marketing departments get the budgets, it’s going to get sillier and sillier. Bootstrap does ease the pain considerably, but in this day and age it just shouldn’t be a thing anymore. At least it’s a lot more stable and sane than it was during the 90s and the early 2000s.

What other books or resources on Bootstrap do you recommend?

As evidenced several times in the book, the official docs these days are really a lot different than the old docs. They’re much easier to read, chock-full of examples, and of exceptional quality.

Keeping an eye on my Twitter stream at @shawty_ds is usually a good idea too. I write for a number of different outlets and blogs, on all manner of software development topics, and most of it is advertised either via my Twitter or my LinkedIn feed.

Smashing Magazine, CSS-Tricks, and all the other major web development outlets are always worth following. Again, not Bootstrap-specific, but there’s usually a hefty chunk of Bootstrap-related goodness.

Finally, Cooper Press here in the UK does a large number of weekly newsletters, in particular one called “Frontend Focus” that deals with all HTML/CSS topics, not just Bootstrap.

What are three key pieces of info that developers can take away from this book?

That’s a tough one.

  • Web UI layout doesn’t have to be hard for anyone, least of all back-end developers.
  • Visual communication seems to be more important with clients and stakeholders in this day and age. Bootstrap helps with that, a lot.
  • Don’t reinvent something you don’t have to. Learn your tools, learn what they do, and how they work with and complement each other.

Do you have any tips for developers trying to learn Bootstrap?

One main one, and not just for Bootstrap: Practice, practice, practice, practice, practice…then play for a little while, and then practice some more.

Far too many developers think that learning a new thing is all about finding all the blogs they can and all the reading material and videos they can, then just copying what everyone else does, but it’s not. It’s about playing and experimenting. Load up a text editor, and try some stuff. If it doesn’t work, throw it away and try something else. What does the row class in Bootstrap do? Assign it to an element, render it, and have a look. Copying verbatim what everyone else does these days is one of the reasons we don’t innovate so much anymore. Try something bold and new. Just play, Play like you did when you were a toddler and you didn’t care about the world around you. Once ideas start to form, practice them and keep practicing them. You’ll see the difference soon enough.

Who are your role models in the developer world?

Funny enough, when I first got involved in .NET I had an absolute boatload of people who I used to look up to. As I’ve gotten to know many of them personally over the years, however, I’ve come to realize that there’s nothing special about them. They’re just regular developers like me, and in fact, many of them have the same kind of mentality as me too, where they really don’t like being put on a pedestal, and would rather folks just interacted with them like they would any other developer.

If you’d asked me this question 10 or even 15 years ago, I would have given you a list as long as my arm. These days the only ones I still hold in really high regard are some of the early pioneers like John Carmack and John Romero or the ones that even today still try to help shape the industry for the better, like Joel Spolsky.

Anyone who has the tenacity to get up and go out into the community to share their knowledge, their experiences, and their war stories gets my vote. It’s not about being better than other developers. We’re all equal. Every one of us knows things that others don’t, and likewise, every one of us also knows what we don’t know, even the big guns. Beginners, this is a very, very, very important lesson to learn because you’ll never get very far in software development until you learn to embrace knowing the things that you don’t yet know.

How quickly can you learn a new programming language or tool?

Yikes! That’s a curveball question. Anywhere from 5 minutes up to a year or more.

Seriously though, these days, I can pick up a new language in a very short amount of time, especially if it’s a C-like language. For the most part these days I mostly tend to use C#, but I can program in about 20 to 25 different languages, even if I’m a bit rusty in some of them.

Tools on the other hand, well, under Windows, things are still mostly standard. File, edit, help menus, etcetera are consistent. As for frameworks, many of them are based around the language they target. There are very few now that are so complicated that it takes anything longer than a week to be able to do anything useful with them.

The latest language I’ve been playing with is Mozilla’s Rust language. It’s an interesting if not quirky idea. When time permits too, I’d like to play with Microsoft’s new Blazor technology, but that’s likely going to be around Christmas, as between now and then, I’m on writing a full-size print book for Packt.

How do you stay up-to-date on industry news?

All the newsletters from all the places coming to me via all the emails!

I have an Android tablet that I’ve waterproofed, and whose sole purpose is to allow me to read these newsletters everywhere, from sitting on the train, to standing in the shower!

I also have an internet-connected TV in the bedroom, and quite often consume an hour or two of MSDN Channel 9, Vimeo, and YouTube content most nights before going to sleep.

If it catches my attention and looks interesting or technical, I’ll read it. Everything from blog posts to scientific white papers released by universities.

Do you have a blog page or a website where people can find you?

shawtyds.wordpress.com. My official home eventually will be shawty.me.uk, but I’m a typical geek and will do everyone else’s websites before I get my own done. I’m on Twitter and LinkedIn too: shawty.me.uk/twitter and shawty.me.uk/linkedin will always redirect you to the appropriate places.

Create Stock charts using Syncfusion angular charts

$
0
0

Investors and analysts typically analyze the price movement of any stock before investing in it, so the graphical representation of this trend makes analysis easier. The chart and range navigator play a key role in tracking and visualizing the stock price of a company over a specific period. In this blog, we’ll walk through how to represent stock analysis with Syncfusion angular charts and range navigator controls for Angular.

                        Stock Chart

Before getting deep into the topic, let us go through the overview of the basic functionalities available in angular charts and range navigator.

Overview

Stunning visualization and analysis of data can be performed using the rich feature set available in our angular charts component. Our angular charts supports 25 types of chart with user interactivity like zooming, tooltip, selection etc. The angular range navigator provides the ability to select a small range of data from a large collection. In another way, range navigator helps to zoom the data in the main chart area. Both components play a key role in financial dashboards to filter and visualize data over a specific period.

Module injection

Module injection is useful when you want to keep your app lightweight, since all the features in Syncfusion angular charts and range navigator are modularized and available as separate services, you can use only the modules you need for your app. For example, when you want to visualize your financial data with a candle chart, injecting CandleSeriesService in the providers is enough.

Customizing stock dashboard

Let’s create a dashboard to visualize and compare the stock prices of different companies like GOOG, AAPL, GOOGL, AMZN and TSLA for the period 2012 – 2015. We’ll visualize the price of these stocks using different types of series such as candlehollow candlelinehiloHiLoOpenClose, and spline.

In addition to this, we are going to add indicators and trendlines for this data to analyze the past and predict the future market trends based on historic price, volume, and open interest.

To help you select and visualize data for different periods, a period selector feature is included in the sample. Other than these functionalities, we also have options to print and export the report for further use.

Getting started

To create an Angular application, install the Angular CLI globally using the following command.

 npm install -g @angular-cli 
 ng new my-app

After the Angular application has been created, use the following command to install the chart package which includes both the chart and range navigator component.

 cd my-app
 npm install @syncfusion/ej2-ng-charts --save

  Now create an Angular component to render the chart and range navigator.

 F:\Development\Blogs\my-app>ng generate component chart 

Next, import the chart and range navigator module in the app.module.ts file.

 
import { BrowserModule } from '@angular/platform-browser';
import { NgModule } from '@angular/core';
import { AppComponent } from './app.component';
import { ChartComponent } from './chart/chart.component';
//ej2 Chart module
import { ChartAllModule, RangeNavigatorAllModule} from '@syncfusion/ej2-ng-charts';

@NgModule ({
  declarations: [ AppComponent,ChartComponent  ],
  imports: [ BrowserModule, ChartAllModule, RangeNavigatorAllModule],
  bootstrap: [AppComponent]
})
export class AppModule { }

Initialize the chart and range navigator component in chart.component.html file.

<ejs-rangenavigator> </ejs-rangenavigator>
<ejs-chart> </ejs-chart>

Populating required data

First, let’s visualize the stock price of GOOG with candle and column series on initial loading. Define the CandleSeriesService and ColumnSeriesService in the providers of the app.module.ts file.

  
 import { CandleSeriesService, ColumnSeriesService } from '@syncfusion/ej2-ng-charts/src/chart/chart.component';
@NgModule ({
  providers: [CandleSeriesService, ColumnSeriesService],
})
export class AppModule { }

Then, add JSON data for the stock price of the company to your application and assign it to the dataSource property in the series.

public stockData: object[] = [
    { x: new Date("2012-04-02"), open: 85.975716, high: 88.395714, low: 85.76857, close: 88.375717, volume: 14958790 },
    { x: new Date("2012-04-03"), open: 89.614288, high: 90.315712, low: 88.93, close: 89.902855, volume: 20863990 },
    { x: new Date("2012-04-04"), open: 89.192856, high: 89.408569, low: 88.14286, close: 89.187141, volume: 14324520 },
    { x: new Date("2012-04-05"), open: 89.568573, high: 90.665718, low: 89.057144, close: 90.525711, volume: 16032450 },
    { x: new Date("2012-04-09"), open: 89.447144, high: 91.405716, low: 89.328575, close: 90.889999, volume: 14938420 },
    { x: new Date("2012-04-10"), open: 91.418571, high: 92, low: 89.428574, close: 89.777145, volume: 22243130 },
]
 
<ejs-chart id="chart-container" [primaryXAxis] = 'primaryXAxis' >
<e-series-collection>
<e-series [dataSource]='stockData' yAxisName='secondary' width='2' type='Column' xName='x' yName='volumn'> </e-series>
<e-series [dataSource]='stockData' width='2' type='Candle' xName='x' yName='close' high='high' low='low' open='open' close='close' volume='volume' name='Apple Inc' bearFillColor='#2ecd71' bullFillColor='#e74c3d'> </e-series>
</e-series-collection>
<ejs-chart>

Since we are going to show the volume in separate row, we need to customize the axes and rows of chart as below.

export class AppComponent implements OnInit {
  public primaryXAxis: Object;
  public primaryYAxis: Object;
  public rows: Object;
  public axes: Object;
  ngOnInit(): void {
   this.primaryYAxis = {
        plotOffset: 25,
        rowIndex: 1, opposedPosition: true,
        rangePadding: 'None',
    };
   this.primaryXAxis = { valueType: 'DateTime' };
   this.rows = [
     { height: '15%' },
     { height: '85%' }
   ];
   this.axes = [{
    name: 'secondary', opposedPosition: true, rowIndex: 0,
   }];
 }
}

After adding series, the chart will appear as shown in the following screenshot.

                Candle chart to show open, high, low, and close price of GOOG.

Period selector

Using the previous code snippet, the stock price details for the company GOOG have been visualized. Now you can select data for a specific period using the period selector feature in the range navigator. You can access this functionality by injecting the PeriodSelector in the providers and enabling the disableRangeSelector property in the range navigator.

import { ChartModule } from '@syncfusion/ej2-ng-charts';
import { PeriodSelector } from '@syncfusion/ej2-ng-charts';
  @NgModule({
  imports: [ BrowserModule, ChartModule ],
  providers: [PeriodSelector]
 })

Now assign the GOOG data to the dataSource property in the range navigator and define the periods for which you want to visualize data.

 
` <ejs-rangenavigator valueType='DateTime' (changed)='rangeChanged($event)'
   disableRangeSelector=true [dataSource]='stockData' xName='x' yName='close' [periodSelectorSettings]='periods'>
  </ejs-rangenavigator>`
 
export class AppComponent implements OnInit {
  public periods: Object;
  ngOnInit(): void {
  this.periods = {
        position: 'Top',
        periods: [{ text: '1M', interval: 1, intervalType: 'Months' },
                 { text: '3M', interval: 3, intervalType: 'Months' },
                 { text: '6M', interval: 6, intervalType: 'Months' },
                 { text: 'YTD' },
                 { text: '1Y', interval: 1, intervalType: 'Years' },
                 { text: '2Y', interval: 2, intervalType: 'Years' },
                 { text: 'All' }]
     };    
  }
}

After enabling the period selector, the range navigator will appear as shown in the following screenshot. You can now interact with the periods in the range navigator to select data.

                Chart with period selector to select data for specific period.

Adding indicators and trendlines

You can add indicators and trendlines to the plotted data to analyze the past and predict future market trends based on the price, volume, or open interest. Using the selectorRender eventyou can add custom elements to the period selector in the range navigator.

 
<ejs-rangenavigator (selectorRender)='selectorRender($event)'>
</ejs-rangenavigator>
export class AppComponent implements OnInit {  
   ngOnInit(): void {
     this.selectorRender = (args: IRangeSelectorRenderEventArgs) => { 
      let indicatorModel: ItemModel = {
        template: ' ', align: 'Left'
      };      
      let trendLineModel: ItemModel = {
        template: ' ', align: 'Left'
      };      
      args.selector.splice(0, 0, trendLineModel);
      args.selector.splice(0, 0, indicatorModel);       
    };  
  }
}

Now, let’s customize the elements in the loaded event of the range navigator with a drop-down list to show the indicator and trend line types available in the chart. Using the changed event of the drop-down, you can add selected indicators and trend lines to the chart dynamically.

 
<ejs-rangenavigator (loaded)='rangeLoaded($event)' >
</ejs-rangenavigator>
export class AppComponent implements OnInit {
  ngOnInit(): void {
      this.rangeLoaded = (args: IRangeLoadedEventArgs) => {
       let indicatorType: DropDownButton = new DropDownButton({
         items: [{ text: 'TMA' }, { text: 'Bollinger Bands' }, { text: 'RSI' }, { text: 'SMA' },
         { text: 'MACD' }],
         iconCss: 'e-icons e-add', cssClass: 'e-caret-hide',
         select: (args: MenuEventArgs) => { 
              this.indicators.push(type);
              this.chart.indicators = this.chart.indicators.concat(indicator);
              this.chart.refresh();
        },
      });
     indicatorType.appendTo('#indicatorType');
     let trendType: DropDownButton = new DropDownButton({
        items: [{ text: 'Linear' }, { text: 'Polynomial' }, { text: 'MovingAverage' }],
        select: (args: MenuEventArgs) => {
          let type: TrendlineTypes = args.item.text;
          this.chart.series[1].trendlines[0].animation.enable = false;
          this.chart.series[1].trendlines[0].width = 3;
          this.chart.series[1].trendlines[0].type = type;
          this.chart.refresh();
        },
        iconCss: 'e-icons e-add', cssClass: 'e-caret-hide'
      });
      trendType.appendTo('#trendType');
   }
  }
 }

                 Options to add indicators and trendlines for the data.

Adding different series types

You can view stock data with different series types available in the chart. For example, if you want to view the close price of the stock, use line or spline series by binding the close value of the stock to the yName property in the series.  The HiLo series can be used to represent the high and low values of a stock for a specific period.

Using the selectorRender eventyou can add a dropdown in the period selector to list the series types. Using the changed event of the drop-down, you can change the series type dynamically.

<ejs-rangenavigator (selectorRender)='selectorRender($event)' (loaded)='rangeLoaded($event)'>
</ejs-rangenavigator>
export class AppComponent implements OnInit {
    ngOnInit(): void {
     this.selectorRender = (args: IRangeSelectorRenderEventArgs) => {
      let seriesModel: ItemModel = {
        template: ' ', align: 'Left'
      };
      args.selector.splice(0, 0, seriesModel);  
      };  
     }
     this.rangeLoaded = (args: IRangeLoadedEventArgs) => {
     let seriesType: DropDownButton = new DropDownButton({
        items: [{ text: 'Line' }, { text: 'Hilo' }, { text: 'HiloOpenClose' },
        { text: 'Hollow Candle' }, { text: 'Spline' }, { text: 'Candle' }],
        select: (args: MenuEventArgs) => {
          if (args.item.text === 'Candle') {
            this.chart.series[1].enableSolidCandles = true;
            this.chart.series[1].type = 'Candle';
          } else if (args.item.text === 'Hollow Candle') {
            this.chart.series[1].enableSolidCandles = false;
            this.chart.series[1].type = 'Candle';
          } else {
            this.chart.series[1].type = args.item.text;
          }
          this.chart.refresh(); 
        },
      });
      seriesType.appendTo('#seriesType');
  }
 }
}

Change the series type from candle to spline, to view the closed price of stock.

                     Different types of chart to view the data about the stock price.

Adding user interaction

To track the details about a stock price over a period or range, use the crosshair and zooming features. With these features, you can hover over any region in the chart to display the stock value of the company in an annotation with respect to the date. You can also zoom in and out of the chart using the mouse wheel to view set of data.

<ejs-chart #chart id='chartStock' [tooltip]='tooltip' [crosshair]='crosshair' (tooltipRender)='tooltipRender($event)' [zoomSettings]='zoomSettings'>
<e-annotations>
<e-annotation content='<div class="e-annotation"id="annotation"></div>' coordinateUnits='Pixel' region='Chart' x='3%' y='12%'
verticalAlignment='Bottom' horizontalAlignment='Far'>
</e-annotation>
</e-annotations>
</ejs-chart>`
export class AppComponent implements OnInit {   
    ngOnInit(): void {
      this.primaryYAxis = {
         crosshairTooltip: { enable: true }, 
      }
      this.primaryXAxis = {
         crosshairTooltip: { enable: true }, 
      }
      this.tooltip = { enable: true, shared: true, header: '', 
                       format: '${point.x} High : ${point.high} Low :' +
                               '${point.low} Open : ${point.open} Close :' +
                               '${point.close} Volume : ${point.volume}'
      };
     this.zoomSettings = { enableMouseWheelZooming: true, mode: 'X', toolbarItems: [] };
     }

                  Tracking details about the stock price using Crosshair and Zooming feature.

Customization

After setting the trend lines, indicators, and scope for the chart, the final thing to do is to export or print it. To do so, add a button in the period selector’s click event to print or export the chart as shown in the following code.

<ejs-rangenavigator (selectorRender)='selectorRender($event)' (loaded)='rangeLoaded($event)'>
</ejs-rangenavigator>
export class AppComponent implements OnInit {  
  ngOnInit(): void {
     this.selectorRender = (args: IRangeSelectorRenderEventArgs) => {
       let printModel: ItemModel = {
        template: ' ', align: 'Right', tooltipText: 'Print'
        };
       let exportModel: ItemModel = {
        template: ' ', align: 'Right', tooltipText: 'Export'
       };      
       args.selector.push(printModel);
       args.selector.push(exportModel);        
    };  
   this.rangeLoaded = (args: IRangeLoadedEventArgs) => {
      let print: Button = new Button({
        iconCss: 'e-icons e-play-icon', cssClass: 'e-flat'
      });
      print.appendTo('#print');
      document.getElementById('print').onclick = () => {
      this.chart.print(['chartStock']);
   };
 }
}

In the previous code example, GOOG data is used to represent the stock price of the company. You can also plot data of other companies dynamically and compare their stock values in a single view using the period selector element. In the following screenshot, we have shown the close price of other companies – AAPL, GOOGL, AMZN and TSLA- using line series.

                                 Tracking details about the stock price using Crosshair and Zooming feature.

Summary

In this blog post, we saw how to use and customize built-in features of the chart and range navigator controls to create a stock chart. We hope you enjoyed it and stay tune to read the posts like this on how to customize Syncfusion controls for real-world application.

We recommend checking out the chart and range navigator components for yourself through the source code available on GitHub, the interactive sample browser, and the documentation to explore all of the features and APIs. Also, be sure to check out the stock chart on GitHub, which is readily runnable to see just how easy it is to create and configure charts.

 If you have any questions or comments, please let us know in the comments below. You can also contact us through our support forum or Direct-Trac. We are always happy to assist you!

If you like this blog post, we think you’ll also like the following free e-books:

JavaScript Succinctly
ECMAScript 6 Succinctly
AngularJS Succinctly
Angular 2 Succinctly

Deep Dive into the Latest Dashboard Platform Features Webinar Q&A

$
0
0

“Deep Dive into the Latest Dashboard Platform Features” was our latest webinar on September 20, 2018. Product specialist Aaron took attendees through connecting to data sources, designing and publishing dashboards, and managing it all in the Dashboard Server. The following blog is the Q&A portion of the webinar. If you missed it, you can find a recording of the webinar on our YouTube page, or you can watch it here:


Q: Can the dashboard data be filtered by the current user logged in?

A: Yes, assuming there is a username column in table against which the currently logged in user can be compared. You create an expression column with the CURRENTUSER function returning a Boolean value and add this expression column in the data filter window.

Q: What best practices do you recommend for very large SQL databases to reduce latency?

A: We recommend that you:

  • Set proper primary and secondary indexing.
  • Choose an appropriate system configuration with good hard disk I/O.
  • Avoid foreign key constraints and handle it in an application layer.
  • Avoid multiple joins and subqueries.
  • Drop indexes before bulk loading data.


Q: Is there a preference to create expressions server side (DB) if possible vs. in the DB builder (is there a performance inference)?

A: No. Expressions can be created client side (Dashboard Designer). Its execution occurs server side (DB) for computing results. Hence, the execution performance completely depends on the query execution in the server and network latency.


Q: Can you create a widget that monitors some value on a refresh schedule and then if that value changes, have it trigger the dashboard to refresh?

A: Yes. You can create a data alert and configure it to the corresponding widget with a criterion set and schedule. On meeting the criteria, an email will be sent to the chosen recipients in the preferred format with the details. Please refer to the following link for more details:

https://help.syncfusion.com/dashboard-platform/dashboard-server/data-alerts. However, notifying the dashboard to refresh based on this is something we plan to support soon.


Q: Can comments be marked as private and/or only shared with certain groups or individuals?

A: As of now, we show the comments to all users who have access to that dashboard. But we have plans to mark comments as private and share to only specific users or groups.


Q: How can we use a combo box to control other tabs?

A: This can be achieved using our Global Filter Panel support, which will be available in our upcoming release scheduled for October.


Q: Is there a way to send a dashboard as an email automatically?

A: Yes. We can schedule dashboards and attach the dashboards as email. Also, on assigning permission to a user for a dashboard, an email will be sent automatically to that user with the dashboard link.


Q: When can we change the size of fonts and add themes?

A: This is in our plans and will be included in our next few releases.


Q: Is the new release coming out in October?

A: Yes. It can be expected by the end of October.


Q: Is there a community where we can go and download custom widgets?

A: Currently we don’t have one. But there is a plan to deploy a gallery for custom widgets. You can expect this in our next few releases.


Q: In the fonts, is it in the release to change the size of a font on data labels?

A: This is in our plans and will be included in our next few releases.


Q: Can we do GeoMaps for city/state/county in the new release?

A: Yes, mapping geodata can be done using our Maps Widget.


Q: It is possible to refresh a file (for example in Google Drive) and have data refreshed also in the dashboard?

A: No. It is possible currently with server databases connected to dashboards alone. Just enabling AutoRefresh in a dashboard will get the updates from an underlying database to the dashboard. Getting updates from a file storage is something in our immediate plans to support.


Q: Is it also in your plans to put the cloud Dashboard Designer the same things that can be found in desktop Designer? I noticed that a couple of important things are missing, e.g., pivot tables and radial gauges.

A: Yes. We have plans to make things equal to the desktop designer. All the widgets available in the desktop designer will be available in the web designer in the near future. Radial gauge will be available in our next update (in October). Pivot table is next.


Q: Is it possible to customize the mobile app with a logo from our company?

A: As of now, this is done on request. We would get details from you and publish the app to app stores on your behalf.


Q: Do you support NoSQL databases (MongoDB)?

A: Yes. MongoDB is supported through ODBC driver (ANSI SQL92 compliant) with ODBC (ANSI SQL) connection.


Q: Do you support json formatted text files?

A: Yes. A JSON connection lets you connect JSON formatted files and access their tables.


Q: The per-server license for $1,995 is perpetual but supported for only one year, or is it for use for only one year?

A: The per-server license for $1,995 is perpetual. However, support is only for one year. Users can renew support each additional year for a small fee.


Q: Can the designer be used to create dashboard UIs without having the Dashboard Server installed?

A: Yes. You can use the designer to create dashboards. You could use the Dashboard SDK to view them in the browser. Designer, too, has a built-in viewer for previewing.


Q: I did not catch if we can connect to SharePoint.

A: Currently not. But it is in our immediate plans to support it.


Q: Is there support for two-factor authentication for Azure?

A: Yes. We have support for two-factor authentication. You could set up the authentication in Azure and connect the Azure AD details in the Dashboard Server.


Q: For white labeling, the cookies message will still show Syncfusion. Can this be updated?

A: Are you referring to the “Powered by Syncfusion” text? You can hide that. See our Site Settings page.


Q: Can you talk about data caching for large datasets?

A: You can use an in-memory cache such as Memcached to improve data access, improve read and write performance, and reduce the number of queries hitting the database. However, our Dashboard Platform doesn’t use an in-memory cache now. It uses an in-memory database to store web and file data sources in an optimized way. We will provide an in-memory cache in a future release.


Q: Do you plan to run any advanced dashboard sessions for advanced users?

A: We currently have another dashboard webinar planned later this year. If you have any topics you would like for us to present on for a future webinar, please send them to marketingteam@syncfusion.com.


Q: Can the background color be set via the designer?

A: Yes. A background color for the card can be customized in designer.


Q: Can the copyright information be hidden from server?

A: Yes. Copyright information can be hidden from the Site Settings.


Q: Is it possible to get version update notifications? I mean notifications as to when you release new version updates of the software.

A: We will post an announcement on our website on the What’s New page for any of our release updates. We also announce it via social media and email. If you would like to sign up to receive email updates, you can adjust your email preferences here.


Q: Do you have any plans to separate the data source layer from the widgets so that when you change a data source in the designer, you do not have to rebuild every widget based on that source?

A: Yes. Our upcoming releases will have related improvements and then while changing a data source in designer, you will feel no pain when a widget refreshes for it.


Q: We do not use Dashboard Server. Can you describe which features are only available with Dashboard Server?

A: User management, permission management, authentication, collaboration, dashboard schedules, and data alerts. These features are only available in the Dashboard Server.


Q: The SDK install method is currently very manual and poorly documented. Any plans to improve them in the near future?

A: Yes. For now, we’ve published tutorial videos that will walk you through installation and deployment. We also have immediate plans to improve the SDK documentation.


Q: For the mobile version, is there support for installing it on Apple TV?

A: As of now, the mobile apps can be installed in Android and Apple mobile phones. For Apple TV, you could open the browser and launch the dashboard server application to showcase the dashboards.


Q: Can the font sizes and colors be changed on the widgets?

A: We can customize the color for widgets from the ‘Properties’ section of the widgets. Font customization support is in our plans and will be included in our next few releases.


Q: Where is theming support?

A: Theming support exists at the SDK level right now. There will be support to configure/switch at the UI level in our upcoming releases.


Q: On the dashboard shown what is considered a data label?

A: Data labels are in charts and maps. They show the value of different regions.

Q: Do you have SPI and CPI widgets?

A: No, we don’t have SPI and CPI widgets. But we can achieve the same results using custom widgets.


Q: Can we use data from two different databases (with separate connection strings) in a single dashboard or even a single widget?

A: Yes. You can create a data source for each of those databases and bind to two different widgets.


If you liked this webinar, we think you’ll be interested in the following free resources:

Essential Studio 2018 Volume 3 Release

$
0
0

Get ready to boost your productivity even more, because Essential Studio 2018 Volume 3 has arrived! You can download the newest batch of updates right now by logging in to your Syncfusion account.

For Volume 3, we homed in on what our users requested the most across our platforms, with special emphasis on our Essential JS 2 and Xamarin collections. In Essential Studio for Xamarin, we added a tree view control for displaying data in a hierarchical structure, and a text input layout control for displaying elements like floating labels and icons on top of input forms. In addition, the chart library now supports stacked donut charts and histograms, and Essential PDF now supports complex-text languages, digital signatures, and bookmark navigation. All these updates are available for Xamarin.Forms, Xamarin.Android, and Xamarin.iOS.

tree-view-for-xamarin
TreeView for Xamarin
textinputlayout-for-xamarin
TextInputLayout for Xamarin

You can see the complete list of new features in our Xamarin suites in our What’s New page.

For Essential JS 2 and all our pure JavaScript components, we’ve added new menu and progress button controls to give you easy-to-use and configure UI tools that your end users will find simply designed and informative. In the Menu control, data binding, templates, multilevel nesting, and different orientations are supported.

pure-javascript-menu
Pure JavaScript Menu

The new ProgressButton control provides a simple indicator inside a button to show end users that an operation is in progress.

javascript-progres-button
Different JavaScript progress button appearances


inserting-a-label-in-the-javascript-richtexteditor-control
Inserting a label in the JavaScript richtexteditor control

For the Schedule control, we’ve implemented a new timeline view that shows both the date and time intervals horizontally across the schedule in day, week, workweek, and month layouts. This view is especially useful for organizing the availability of multiple resources.

javascript-schedule-with-timeline-view
JavaScript Schedule with timeline view

Additionally, rescheduling appointments with drag-and-drop is now supported in the Schedule control, making event management even easier.

On the data visualization side of things, a new Pareto chart type is now available in the Chart control for displaying individual values and their accumulation, and the Heatmap control now supports bubble tiles to provide a new, non-rectangular method of depicting data.

javascript-pareto-view
JavaScript Pareto view

Lest we forget our roots: as with all our volume releases, we’re still improving our collection of Windows Forms controls. This time around, we’re very excited to announce that most of our Windows Forms controls now have high-DPI support, allowing them to render clearly even on the highest-resolution devices. We’ve also added new features for the Windows Forms DataGrid and ListView controls, as well as our file-format libraries.

These are just a few of the highlights of what you can find in the 2018 Volume 3 release. For a complete overview, check out What’s New on our website. If you’re currently a Syncfusion user, you can download all the updates now by logging in to your account. If you’re not yet a Syncfusionite, you can always download a 30-day free trial to test out the latest features for yourself, or browse our extensive samples.

Go Cloud Brings New Functionality to the Go Programming Language

$
0
0

The Go programming language recently received a significant update in the form of a new open source project, Go Cloud. As the name suggests, Go Cloud intends to expand the power of Go to be accessible nearly anywhere a developer may want to work on it. To achieve this, the Go team focused on creating a set of generic APIs that would allow Go to work well with an array of cloud services. With sufficient support, developers would have access to Go on nearly any cloud platform they needed. The ultimate goal isn’t to chain Go developers to a proprietary service or product, but to give them the option to work with the cloud providers they are most comfortable with, even if it changes over time. To learn more about how Go Cloud works, visit the official site.

But what if you are new to Go, or simply want to learn more about this programming language to see if it is right for you? If you aren’t ready to dive into the latest features, you could get a comprehensive introduction by reading Syncfusion’s Go Succinctly by Mark Lewin. Despite being only 104 pages, this ebook allows newcomers to Go to quickly come to grips with the unique features of Go and begin using it in their own projects. With new features such as Go Cloud always improving it, there’s never a bad time to jump in and learn how to develop with Go.

Are you excited about Go Cloud? What cloud services do you most want to see supported? Let us know in the comments below.

If you enjoyed Go Succinctly, we recommend these other free resources:


New Collaboration Aims to Set Big Data Standards

$
0
0

Big data is difficult to manage. It is difficult to store, it is difficult to sort, it is difficult to interpret, and it is difficult to make work for you. But big data is also tremendously valuable, offering fantastic opportunities for developers to create useful apps and to improve their own products and processes. If only there were more consistent and useful standards to help developers manage the flow of data, the rewards of fully investing in big data would be more obtainable.

In response to this need comes the Open Data Initiative. Announced at Microsoft Ignite, the Open Data Initiative is a collaboration between Microsoft, Adobe, and SAP intended to allow big data sets to be transferred across systems, each of which can easily work with the data without compromising its ability to be moved. If it proves successful, this initiative will make it easier than ever for developers to make meaningful use of big data, as it means that the strengths of different solutions can be brought to bear to make the most of any data set. Even if it proves an insufficient solution to the problem, it’s clear that the challenge of shared standards is being treated seriously by major companies in the industry.

open-data-initiative-sap-microsoft-adobe-logos
The power of three major developers is behind the Open Data Initiative.

Syncfusion has long tried to make big data an accessible tool for developers. Our Big Data Platform was the first and is still the only complete Hadoop distribution designed for Windows, Azure, and Linux. We know that developers work across a wide variety of platforms, and we know that it’s simply irresponsible to not strive to make the data you need available across the platforms you use. Similarly, our Data Integration Platform makes it easy to take big data sets—whether from one of our platforms or another—and begin working with them immediately, and compatibility with other tools like our Dashboard Platform bring the power of other Syncfusion solutions to your big data projects. Regardless of what the future holds for projects like the Open Data Initiative, Syncfusion is already on the front lines of making big data easy to work with, regardless of how a developer uses big data.

Are your big data needs being met? Do you think the Open Data Initiative is a solution to the problems you face? Let us know in the comments below.

If you like this blog post, we think you’ll enjoy the following free resources:

What’s New in 2018 Volume 3 Release: Syncfusion File Format libraries (PDF, Excel, Word and PowerPoint)

$
0
0

Syncfusion is excited to share details about the new features and enhancements for our file format libraries that have been included in the Essential Studio 2018 Volume 3 release based on your valuable feedback. Syncfusion’s file format libraries allow users to create, edit, write, and convert Excel, PDF, Word, and PowerPoint files in .NET Framework, .NET Core, Xamarin, and UWP applications without the need of Microsoft Office or Adobe dependencies.

In this blog, let’s see the new items included in the 2018 Volume 3 release of our file format libraries.

Essential PDF

Complex script language support

Essential PDF allows you to add complex script language (Devanagari, Tamil, Hindi, Thai, etc.) text support in PDF documents in any .NET application.

The following code example shows how to draw complex script (Thai) text.

//Create a new PDF document.
PdfDocument doc = new PdfDocument();

//Add a page to the document.
PdfPage page = doc.Pages.Add();

//Create PDF graphics for the page.
PdfGraphics graphics = page.Graphics;

//Set the font with Unicode option.
Font font = new Font("Tahoma", 14);

PdfFont pdfFont = new PdfTrueTypeFont(font, true);

//Set the format for string
PdfStringFormat format = new PdfStringFormat();

//Set the format as complex script layout type.
format.ComplexScript = true;

//Draw the text.
graphics.DrawString("เอกสาร PDF มีการใช้อย่างแพร่หลายเป็นเวลาหลายปีและนับสิบ ๆ แถมฟรี ผู้อ่าน
PDF เชิงพาณิชย์บรรณาธิการและห้องสมุดพร้อมใช้งาน อย่างไรก็ตามแม้จะมี
ความนิยมนี้ก็ยังคงยากที่จะหาคำแนะนำกระชับรูปแบบ PDF พื้นเมือง
การทำความเข้าใจการทำงานภายในของ PDF ทำให้สามารถสร้างได้แบบไดนามิก
เอกสาร PDF ตัวอย่างเช่นเว็บเซิร์ฟเวอร์สามารถดึงข้อมูลจากฐานข้อมูล
ใช้เพื่อกำหนดใบกำกับสินค้าและให้บริการกับลูกค้าได้ทันที", pdfFont, PdfBrushes.Black, new RectangleF(0, 0, page.GetClientSize().Width, page.GetClientSize().Height), format);

//Save the document.
doc.Save("Output.pdf");

//Close the document.
doc.Close(true);

Drawing complex script text in PDF

To learn more about adding complex script language text to an existing PDF, please refer to our documentation page, Drawing complex script text in PDF.

Redaction

Now you can redact text and images from a PDF document. Redaction is the process of removing sensitive or unwanted content from a document.

The following code example shows how to redact PDF documents.

//Load an existing PDF.
PdfLoadedDocument document = new PdfLoadedDocument(“input.pdf”);

//Get the first page from document.
PdfLoadedPage page = document.Pages[0] as PdfLoadedPage;

//Create PDF redactions for the page.
PdfRedaction redaction = new PdfRedaction(new RectangleF(343, 147, 60, 17), System.Drawing.Color.Black);

//Add the redaction to loaded page.
page.Redactions.Add(redaction);

//Save and close the PDF document.
document.Save("Redacted.pdf");
document.Close(true);

PDF redaction - remove sensitive content from PDF

To learn more about PDF redaction, please refer to our PDF Redaction documentation page.

Signature appearance validation

Essential PDF now supports displaying a signature status based on the signature validation in a PDF document.

The following code example shows how to enable signature appearance validation.

//Create new document.
PdfDocument document = new PdfDocument();

PdfPageBase page = document.Pages.Add();

PdfGraphics graphics = page.Graphics;

PdfCertificate pdfCert = new PdfCertificate(@"PDF.pfx", "syncfusion");

PdfSignature signature = new PdfSignature(document, page, pdfCert, "Signature");

signature.Bounds = new Rectangle(10, 20, 400, 200);

signature.EnableValidationAppearance = true;

//Sets signature information.

signature.Appearance.Normal.Graphics.DrawString("Signature validation", new PdfStandardFont(PdfFontFamily.TimesRoman, 24), PdfBrushes.Black, 0, 50);

document.Save("Output.pdf");

document.Close(true);

signature appearance validation

Long Term Validation

Long Term Validation (LTV) is now supported in our PDF library. This feature can be used for archiving digitally signed PDF documents and it contains all necessary certificates (a valid CRL and OCSPs) to validate the document.

The following code example shows how to enable LTV.

//Initialize the PDF document.
PdfDocument doc = new PdfDocument();

//Add page to PDF document.
PdfPage page = doc.Pages.Add();

//Initialize certificate.
PdfCertificate pdfCert = new PdfCertificate("PDF.pfx", "syncfusion");

//Initialize signature.
PdfSignature signature = new PdfSignature(page, pdfCert, "field");

//Adding TimeStamp to signature.
signature.TimeStampServer = new TimeStampServer(new Uri("https://”);

signature.EnableLtv = true;

//Sets the bounds of signature.
signature.Bounds = new RectangleF(new PointF(0, 0), new SizeF(100, 100));

signature.Reason = "I am author of this document.";

doc.Save("LTV.pdf");
doc.Close(true);

Long term validation of digital signature

Rubber stamp annotation flattening

Now, you can flatten rubber stamp annotations in a PDF document to remove their editing capability.

The following code example shows how to flatten a rubber stamp annotation.

//Load the existing PDF document.
PdfLoadedDocument loadedDocument = new PdfLoadedDocument("input.pdf");
//Get all the pages.
foreach (PdfLoadedPage loadedPage in loadedDocument.Pages)
{
//Get all the annotations in the page.
foreach (PdfLoadedAnnotation annotation in loadedPage.Annotations)
{
//Check for the rubber stamp annotation.
if (annotation is PdfLoadedRubberStampAnnotation)
{
//Flatten the rubber stamp annotation.
annotation.Flatten = true;
}
}
}
//Save and close the PDF document instance.
loadedDocument.Save("Output.pdf");
loadedDocument.Close(true);

flattening stamp annotation

Measurement annotation

Essential PDF now supports adding measurement annotations (Line, Square, Circle and Angle) in a PDF document.

The following code example shows how to create measurement annotations.

//Initialize the PDF document.
PdfDocument doc = new PdfDocument();

//Add page to the document.
PdfPage page = doc.Pages.Add();

//Creates a new Line measurement annotation.
int[]  points = new int[] { 350, 750, 500, 750 };

//Initialize the Line measurement annotation.
PdfLineMeasurementAnnotation lineMeasureAnnot = new PdfLineMeasurementAnnotation(points);
lineMeasureAnnot.Author = "Syncfusion";
lineMeasureAnnot.Subject = "LineAnnotation";
lineMeasureAnnot.ModifiedDate = new DateTime(2015, 1, 18);
            
//Set the measurement Unit to display the length of Line.
lineMeasureAnnot.Unit = PdfMeasurementUnit.Inch;
lineMeasureAnnot.LineBorder.BorderWidth = 2;
lineMeasureAnnot.Font = new PdfStandardFont(PdfFontFamily.Helvetica, 10f, PdfFontStyle.Regular);
lineMeasureAnnot.Color = new PdfColor(Color.Red); 

//Add annotation to the page.                  
page.Annotations.Add(lineMeasureAnnot);

doc.Save("MeasurementAnnotation.pdf");
doc.Close(true);

PDF measurement annotation

Timestamp existing PDF document

Already, Essential PDF supports timestamping PDF documents when creating them from scratch. Now, this is extended to timestamping existing PDF documents.

The following code example shows how to timestamp an existing PDF document.

//Load the existing PDF document
PdfLoadedDocument loadedDocument = new PdfLoadedDocument(@"Loaded.pdf");

//Add a new page. 
PdfLoadedPage page = loadedDocument.Pages[0] as PdfLoadedPage;

//Creates a digital signature.
PdfSignature signature = new PdfSignature(page, "Timestamp");

//Add the time stamp by using the server URI.
signature.TimeStampServer = new TimeStampServer(new Uri("https:// "));

//Save and close the document
loadedDocument.Save("Timestamp.pdf");
loadedDocument.Close(true);

timestamp existing PDF document

Essential XlsIO

External reference formulas

An external cell reference in Excel is a reference to a cell or a range of cells outside the current worksheet. The main benefit of using an Excel external reference is that whenever the referenced cell(s) in another worksheet changes, the value returned by the external cell reference is automatically updated.

The following code returns the formula of the cell A1 and its calculated value. Here, the formula references another workbook, which is enclosed in square brackets [Excel.xlsx].

using (ExcelEngine excelEngine = new ExcelEngine())
{
    IApplication application = excelEngine.Excel;
    IWorkbook workbook = application.Workbooks.Open(GetFullTemplatePath("FormulaExcel.xlsx"));
    IWorksheet worksheet = workbook.Worksheets[0];
    worksheet.EnableSheetCalculations();

    this.Hide();
    MessageBox.Show("A1 Cell Formula : " + worksheet.Range["A1"].Formula + "\n" +
    "A1 Cell Calculated Value : " + worksheet.Range["A1"].CalculatedValue);

    workbook.SaveAs(GetFullOutputPath("FormulaExcel.xlsx"));
    workbook.Close();
}


external formula reference
External formula reference

To learn more about working with Excel formulas, please refer to our Excel formula documentation.

Excel to image in .NET Core and Xamarin

The Syncfusion Excel (XlsIO) library extends its support to convert Excel worksheets to images in .NET Core. With this feature, either a full worksheet or a specific range can be converted to an image as a JPEG or PNG. They can also be saved to a memory stream. Excel files can be converted to images with:

  • Pivot tables
  • Conditional formats
  • Styles
  • Rich text
  • Text alignment
  • Images
  • Text boxes
  • Unicode characters

The NuGet packages Syncfusion.XlsIORenderer.Net.Core for ASP.NET Core and Syncfusion.Xamarin.XlsIORenderer for Xamarin are available in NuGet.org.

The following code shows how to convert a worksheet to an image using XlsIORenderer.

using (ExcelEngine excelEngine = new ExcelEngine())
{
    IApplication application = excelEngine.Excel;           

    //Open workbook from file stream.
    IWorkbook workbook = application.Workbooks.Open(new FileStream(@"/XlsIO/ExpenseReport.xlsx", FileMode.Open, FileAccess.Read));
    IWorksheet worksheet = workbook.Worksheets[0];

    //Initialize XlsIO renderer.
    IXlsIORenderer renderer = new XlsIORenderer();
    Stream stream = new FileStream(DataPathOutput + "Image.png", FileMode.Create, FileAccess.ReadWrite);

    //Set image export options.
    ExportImageOptions imageOptions = new ExportImageOptions()
    {
        ScalingMode = ScalingMode.Best,
        ImageFormat = ExportImageFormat.Png,
    };

    //Convert worksheet to image.
    renderer.ConvertToImage(worksheet.UsedRange, imageOptions, stream);

    //Save and dispose.
    workbook.SaveAs(stream);
    workbook.Close();
}
convert Excel worksheet to image
Excel worksheet to image

To learn more about Excel-to-image conversion, please refer to our Excel to image conversion documentation.

Excel to HTML in .NET Core and Xamarin

The Syncfusion Excel (XlsIO) library extend its support to convert an Excel workbook or worksheet to an HTML file in .NET Core, available from .Net Standard 1.4 onwards. A single worksheet or an entire workbook can be converted to an HTML file.
Excel files can be converted to HTML with:

  • Data
  • Styles
  • Conditional formats
  • Rich text
  • Text alignment
  • Images
  • Text boxes

The following code shows how to convert a workbook to HTML.

using (ExcelEngine excelEngine = new ExcelEngine())
{
IApplication application = excelEngine.Excel;
IWorkbook workbook = application.Workbooks.Open(File.Open(DataPathBase + "NorthwindTemplate.xlsx", FileMode.Open));
IWorksheet worksheet = workbook.Worksheets[0];

//Create stream to store an HTML file.
Stream stream = new FileStream(DataPathOutput + "NorthwindTemplate.html", FileMode.Create, FileAccess.ReadWrite);

//Save and dispose.
workbook.SaveAsHtml(stream);
stream.Dispose();
workbook.Close();
}
Excel workbook to HTML

For more information about Excel-to-HTML conversion, please refer to our Worksheet to HTML documentation.

Sort by value in pivot table

Pivot table allows custom sorting in Excel that helps to sort values by a specific row or column. The Syncfusion Excel (XlsIO) library allows you to sort pivot values by row or column using the AutoSort() method in IPivotField interface. Here, the sorting can be done either top-to-bottom or left-to-right.

The following code shows how to sort by value in pivot table.

using (ExcelEngine excelEngine = new ExcelEngine())
{
IApplication application = excelEngine.Excel;

IWorkbook workbook = application.Workbooks.Open(fileStream);
IWorksheet sheet = workbook.Worksheets[1];
IPivotTable pivotTable = sheet.PivotTables[0];

//Pivot table top-to-bottom sorting.
IPivotField rowField = pivotTable.RowFields[0];
rowField.AutoSort(PivotFieldSortType.Ascending, 1);

//Pivot table left-to-right sorting.
IPivotField columnField = pivotTable.ColumnFields[0];
columnField.AutoSort(PivotFieldSortType.Ascending, 1);

string fileName = "PivotFieldAutoSort.xlsx";

//Save the workbook as stream.
FileStream stream = new FileStream(fileName, FileMode.Create, FileAccess.ReadWrite);
workbook.SaveAs(stream);
}

Excel-to-PDF enhancements

Now, Essential XlsIO provides the following two enhancements during Excel-to-PDF conversion in the .NET Framework:

  • Grouped shapes with fill settings and line settings.
  • Images that are recolored in Excel with the options: black and white, color change, duotone, and gray scale.

For more information, please refer to our Excel to PDF conversion documentation.

Data import enhancement

URLs and mail IDs from DataTable, Array, or CLR objects used to be imported as strings. With this new feature, these URLs and mail IDs are imported as hyperlinks, as shown in the following image.

import data to excel with hyperlinks
Import as hyperlinks

It is now possible to add hyperlinks to images that are imported from CLR objects (collection).

For code examples, please refer to our Importing data to Excel documentation.

Essential Presentation

Right-to-left text during PPTX to PDF conversion

Essential Presentation now allows you to preserve the right-to-left (RTL) text (Arabic, Hebrew, Urdu) and bi-directional (bidi) text in PowerPoint documents while doing PDF-to-image conversions. Please refer to this PowerPoint to PDF conversion user guide for the code examples to convert a PowerPoint file to PDF or image formats.

right-to-left text supported during PPTX to PDF conversion

Add or edit transitions in PowerPoint slides

Slide transitions are the motion effects that occur when you move from one slide to the next during a slide show presentation. A transition can be a simple push to the next slide or an eye-catching transition effect. You can control the speed, add sound, and customize the properties of transition effects. For more information, please refer to our user guide page, Applying or editing transitional effects in PowerPoint slides.

//Create a PowerPoint presentation.
using (IPresentation presentation = Presentation.Create())
{
//Add a slide to the presentation.
ISlide slide = presentation.Slides.Add();

//Add text to the slide.
Slide.Shapes.AddTextBox(10, 10, 100, 100).TextBody.AddParagraph("Hello world");

//Set the transition effect type.
slide.SlideTransition.TransitionEffect = TransitionEffect.PageCurlDouble;

//Set the transition effect option.
slide.SlideTransition.TransitionEffectOption = TransitionEffectOption.Right;

//Set the trigger mode for the transition as after a click.
slide.SlideTransition.TriggerOnClick = true;

//Set the transition duration value. This specifies the length of the transition.
slide.SlideTransition.Duration = 30;

//Set the time delay mode for the transition.
slide.SlideTransition.TriggerOnTimeDelay = true;

//Set the transition delay in seconds. Move to the next slide after this certain number of seconds.
slide.SlideTransition.TimeDelay = 30;

//Save the PowerPoint file.
presentation.Save("SlideTransition.pptx");
}
PowerPoint slide transition
An illustration of transitions created by Essential Presentation

What’s Next

If you are an existing Syncfusion user, please download the new version from the License and Downloads page and try the new features for yourself. Our NuGet packages are available in NuGet.org, also. If you are a new customer, you can try our 30-day free trial to check out these features.

If you are new to Syncfusion’s file format libraries, we highly recommend that you follow our user guide. To get started quickly with your desired file format, please follow these links:

Create PDF file in C# without Adobe
Create Excel file in C# without Microsoft Office
Create Word file in C# without Microsoft Office
Create PowerPoint file in C# without Microsoft Office

If you have any questions or require clarification on these features, please let us know in the comments below. You can also contact us through our support forum or Direct-Trac. We are happy to assist you!

Essential JS 2: Copying and Pasting Excel Sheet Data to Grid ASP.NET MVC

$
0
0

Copy and paste are most frequently used actions in applications. One of the important action is copying data from excel and pasting it to the grid in web browser but achieving this scenario would be very tricky because browser prevent paste option from clipboard due to security reasons.

Here we are going to guide you to achieve copy and paste Excel sheet data to Essential JS 2 ASP.NET MVC Grid. If you are new to ASP.NET MVC Essential JS 2 Grid, then please refer the getting started of grid control.

Setting up the development environment

All Essential JS 2 components are available as nuget packages. You can use them to integrate in your ASP.NET MVC project.

Prerequisites

The following items are required to use Essential JS 2 component in ASP.NET MVC application.

  • Net Framework 4.5 and above.
  • NET MVC 4 or ASP.NET MVC 5
  • Visual Studio

Creating ASP.NET MVC web application

If you have an existing ASP.NET MVC project, then you can jump to the next section. If not, please create one by selecting File-> New -> Project.

ASP.NET MVC DataGrid - Create ASP.NET MVC Web Application wizard

Select the MVC as project template from the project template wizard to create MVC web application.

ASP.NET MVC DataGrid - Create ASP.NET MVC Web Application wizard - Select template

Adding Syncfusion packages

Now we are going to add Essential JS 2 packages to our web application using nuget package

To add Essential JS 2 package, open Nuget Package Manager by selecting Project -> Manage Nuget Packages… and search for Essential JS 2 nuget packages by using keyword “essentialjs2”.

ASP.NET MVC DataGrid - Add Syncfusion Essential JS 2 nuget package

Now we will be left with the above available Syncfusion nuget packages which we can select as per our requirement. Since the project, we created from the previous step uses MVC5, I am going to select and install Syncfusion.EJ2.MVC5 package from the list.

Configuring assemblies and namespaces in Web.config file

We have successfully added Syncfusion packages in web application. Now we need to register the Essential JS 2 assemblies and namespaces in the Web.config file.

[Views/Web.config]

<namespaces>
 <add namespace="System.Web.Mvc" />
 <add namespace="System.Web.Mvc.Ajax" />
 <add namespace="System.Web.Mvc.Html" />
 <add namespace="System.Web.Optimization"/>
 <add namespace="System.Web.Routing" />
 <add namespace="EJ2_MVC_Grid_Copy_Paste" />
 <add namespace="Syncfusion.EJ2"/>
</namespaces>

[Web.config]

  <system.web>
    <authentication mode="None" />
    <compilation debug="true&uot; targetFramework="4.6&aquot;>
      <assemblies>
        <add assembly="Syncfusion.EJ2"/>
      </assemblies>
    </compilation>
    <httpRuntime targetFramework="4.6" />
  </system.web>

Now the application is configured with Essential JS 2 packages. We will see how to add grid control to this application.

Adding Script and theme

Apart from Essential JS 2 packages, we need to refer the client side resources to render the grid control. Essential JS 2 provides below list of built-in themes.

  • Material
  • Office 365
  • Bootstrap
  • High Contrast

For this demo, we have added the material theme of the grid control in _Layout.cshtml page.

<link href="//cdn.syncfusion.com/ej2/ej2-grids/styles/material.css" rel="stylesheet"/>

Add ej2.min.js file to the _Layout.cshtml page.

<script src="//cdn.syncfusion.com/ej2/dist/ej2.min.js"></script>

Adding Script Manager

You need to add the Essential JS 2 script manager at the bottom of the _Layout.cshtml page. It will maintain  client side resources to render the grid control.

<body>
    . . . .  .
    @Html.EJS().ScriptManager();
</body>

Providing Row Data

Here we have initialized collection of data for dataSource at the controller which will be passed to the Index.cshtml page by ViewBag.

    public class HomeController : Controller
    {
        public static List&amp;amp;lt;Orders&amp;amp;gt; OrdersList = new List&amp;amp;lt;Orders&amp;amp;gt;();
        public ActionResult Index()
        {
            OrdersList = new List&amp;amp;lt;Orders&amp;amp;gt;() {
                new Orders() { OrderID = 10248, CustomerName = &amp;amp;quot;VINET&amp;amp;quot;, ShipCountry = &amp;amp;quot;Rio&amp;amp;quot;, Freight = 32.48, OrderDate = DateTime.Now },
                new Orders() { OrderID = 10249, CustomerName = &amp;amp;quot;HANAR&amp;amp;quot;, ShipCountry = &amp;amp;quot;Alaska&amp;amp;quot;, Freight = 2.8, OrderDate = DateTime.Now }
            };
            ViewBag.dataSource = OrdersList;
            return View();
        }	
    }

Adding Grid control

Now the application is all set and you can add the grid control to the application. For this demo, we have initialized a simple grid in the Index.cshtml page with DataSource from Viewbag as shown in the below code example.

  @(Html.EJS().Grid(&amp;amp;quot;grid&amp;amp;quot;)
        .DataSource((List&amp;amp;lt;EJ2_MVC_Grid_Copy_Paste.Controllers.Orders&amp;amp;gt;)ViewBag.dataSource)
        .Columns(col =&amp;amp;gt;
        {
            col.Field(&amp;amp;quot;OrderID&amp;amp;quot;).HeaderText(&amp;amp;quot;Order ID&amp;amp;quot;).TextAlign(Syncfusion.EJ2.Grids.TextAlign.Right).Width(&amp;amp;quot;120&amp;amp;quot;).Add();
            col.Field(&amp;amp;quot;CustomerName&amp;amp;quot;).HeaderText(&amp;amp;quot;Customer Name&amp;amp;quot;).Width(&amp;amp;quot;150&amp;amp;quot;).Add();
            col.Field(&amp;amp;quot;ShipCountry&amp;amp;quot;).HeaderText(&amp;amp;quot;Ship Country&amp;amp;quot;).Width(&amp;amp;quot;130&amp;amp;quot;).Add();
        })
        .Render())

Now when we run the application, we can see the grid control as follows.

Essential JS 2 ASP.NET MVC DataGrid: Initial Rendering

Configuring paste action

Now we are going to configure our application and grid to handle paste operation. For simplicity, I am going to split this section into below three sub sections. They are,

  1. Registering paste event
  2. Converting Pasted Data to JSON
  3. Add Action to handle pasted data

Registering paste event

We need to register paste event to the grid element and the paste operation will be handled at the event handler. We can take leverage of the paste event as it has no effect when pasted target is not content editable.

In the paste event handler, we need to get the pasted data and parse it to JavaScript objects. Then the JSON data can be send to a controller action where we do the data merge operation. Then at the success handler, we have to refresh the grid with the new data source.

    document.getElementById('grid').addEventListener('paste', function (e) {
        var tsv = e.clipboardData.getData('Text')
        
        if (tsv) {
            var ajax = new ej.base.Ajax("@Url.Action("OnPaste")");
            ajax.type = "POST";
            ajax.send(JSON.stringify({ pastedData: tsvJSON(tsv) }))
                .then(function (data) {
                    var grid = document.getElementById('grid').ej2_instances[0];
                    grid.dataSource = JSON.parse(data);
                });
        }
    });

Converting Pasted Data to JSON

When the copied Excel sheet data is pasted, we will get the pasted data as tab separated values (TSV) in the paste event handler. And we need to convert the pasted TSV data to JSON which can be then assigned to grid data source. We can use the below simple utility function to convert the TSV to JavaScript objects.

    function tsvJSON(tsv) {

        var lines = tsv.trim().split("\n");

        var result = [];

        var headers = lines[0].split("\t");

        for (var i = 1; i < lines.length; i++) {

            var obj = {};
            var currentline = lines[i].split("\t");

            for (var j = 0; j < headers.length; j++) {
                obj[headers[j].trim()] = currentline[j];
            }

            result.push(obj);

        }

        return result; //JSON
    }

Add Action to handle pasted data

Now we need to create a controller action which will be used to merge pasted data with the actual data. When the data get pasted, we will send the pasted data to this action and the pasted data will be added to the actual data source. This action should return the resultant data which will be bound to the grid.

    public class HomeController : Controller
    {
        public static List<Orders> OrdersList = new List<Orders>();
        public ActionResult Index()
        {
            OrdersList = new List<Orders>() {
                new Orders() { OrderID = 10248, CustomerName = &quot;VINET&quot;, ShipCountry = &quot;Rio&quot;, Freight = 32.48, OrderDate = DateTime.Now },
                new Orders() { OrderID = 10249, CustomerName = &quot;HANAR&quot;, ShipCountry = &quot;Alaska&quot;, Freight = 2.8, OrderDate = DateTime.Now }
            };
            ViewBag.dataSource = OrdersList;
            return View();
        }
    
        [HttpPost]
        public ActionResult OnPaste(PostData data, string action)
        {
            OrdersList.AddRange(data.pastedData);
            return Json(OrdersList);
        }
    }

Handling paste event in IE

Internet Explorer triggers paste event only if the paste target is a content editable or form elements. To overcome this problem, we can bind `keydown` event to trap CTRL+V keystroke and handle the paste operation in its event handler.

Now the above event registration and listener code has to be changed as follows.

    document.getElementById('grid').addEventListener(ej.base.Browser.isIE ? 'keydown' : 'paste', function (e) {
        var tsv;
        if (e.ctrlKey && (e.keyCode == 86)) {
            tsv = window.clipboardData.getData('Text');
        } else {
            tsv = e.clipboardData.getData('Text');
        }
        if (tsv) {
            var ajax = new ej.base.Ajax("@Url.Action("OnPaste")");
            ajax.type = "POST";
            ajax.send(JSON.stringify({ pastedData: tsvJSON(tsv) }))
                .then(function (data) {
                    var grid = document.getElementById('grid').ej2_instances[0];
                    grid.dataSource = JSON.parse(data);
                });
        }
    });

When using keydown event you can get the clipboard data using the window.clipboardData property. For security reasons, you will be prompted with a permission access request while pasting data in Internet Explorer that provides access to get clipboard data programmatically.

Essential JS 2 ASP.NET MVC DataGrid: Internet explorer permission prompt

Before Pasting

Essential JS 2 ASP.NET MVC DataGrid: Before pasting excel data


Essential JS 2 ASP.NET MVC DataGrid: Excel sheet dataAfter Pasting

Essential JS 2 ASP.NET MVC DataGrid: After pasting excel dataSummary

In this blog, we have gone through steps for adding grid control to an ASP.NET MVC application and performing copy and pasting Excel Data to the Essential JS 2 Grid. You can also find the runnable demo of this blog in our GitHub repository. To check our features and other details of our ASP.NET MVC DataGrid, you can visit the sample browser and documentation to explore live samples of its features and API.

If you have any questions or require clarification, please let us know in the comments section. You can also contact us through our support forum or Direct-Trac. We are happy to assist you!

Syncfusion JavaScript Scheduler: New Features and Improvements in 2018 Volume 3

$
0
0

Since our previous release, 2018 Volume 2, we had received a lot of requests for support of a timeline view in scheduler. Other than this timeline view, we also received an equal number of requests for the  ability in the scheduler feature to drag and drop appointments, as well as to resize them.

Finally, we’re so glad to announce that our latest 2018 Volume 3 release was rolled out a week ago, packed with all of these most anticipated features for JavaScript scheduler, and the component has now been moved to its final version in this release.

Now, I will summarize the list of scheduler features and improvements that we newly shipped in this release, which are available on all other platforms, too: Angular, React, Vue, ASP.NET MVC, and ASP.NET Core.

Timeline views

Scheduler is now available with four new view modes in addition to its existing views: Timeline Day, Timeline Week, Timeline Work Week, and Timeline Month.

All the interactions on these views are similar to the ones that exist in default views, whereas the UI differs by displaying the horizontal time axis and the appointments across it.

The combined usage of multiple resources and grouping, along with the timeline layout, suit major customer requirements for their scheduling-oriented applications.

scheduler displaying timeline view

Timeline header rows

We have also provided an additional option to format and include custom rows in the header section of all timeline views.

Timeline scheduler displaying custom rows

With this support, you can define individual rows for displaying the year, month, and week number, as well as the usual days and hours, with a customizable template option.

Drag and drop

One of the most anticipated interactive features, drag and drop, has been included for rescheduling an appointment simply by dragging and dropping it onto the required time slot. It has support to work on all scheduler views with the exception of Agenda and Month Agenda views.

scheduler displaying drag action

Resize

Now the extension of appointment duration has been made easier by allowing you to resize the appointments, either through their start or end handlers. You can also resize the shared appointments simultaneously, when the events of multiple resources are grouped on the scheduler layout.

scheduler displaying resize action

Other enhancements

We also made a few enhancements to our scheduler and worked toward eliminating bugs to make the Syncfusion scheduler as stable as we can.

Week number display

You can now display the week number of the current date range beside the date header section in all default views.

scheduler displaying week number

Template option for quick pop-up

One of the most requested customer requirements was to be able to customize the quick pop-up feature through a standard template. To this end, we have included individual template options to customize the header, content, and footer sections of the pop-up that opens when you single-click cells or appointments.

quick pop-up showing appointment information

For existing customers, our new version is available to download from the License and Downloads page. If you are new to Syncfusion, then you can try our 30-day free trial to check out these new features.

Also, if you wish to send us feedback or would like to ask any questions, please feel free to post in the below comments section or else contact us through our support forum or Direct-Trac.

How to Build a Xamarin App: Master Guide from Intro to Features

$
0
0

Syncfusion has been onboard with the awesomeness of Xamarin since before many people knew it was… well, in existence. We have published a large collection of how-to materials to help developers get started with this awesome language and our controls for it. Whether you’re a beginner or a seasoned veteran, there’s always something new to learn. We’ve organized the most useful materials into a single list to save you time.

Getting Started

Xamarin.Forms Succinctly

Xamarin.Forms for macOS Succinctly

Beginners’ YouTube Course

How to Start a Xamarin App from Scratch Webinar  


Intro to Popular Controls

Overview of Data Grid Part 1

Overview of Data Grid Part 2

Overview of Autocomplete Control

Overview of Chart Part 1

Overview of Chart Part 2

Need a List View for your Xamarin.Forms App?

Overview of the Progress Bar Control

Design a Temperature Monitor Using the Circular Gauge


Building Practical Apps Using Xamarin

Build Better Mobile Apps with Xamarin.Forms and Syncfusion

  • Webinar recording featuring the Carousel, ListView, PDF Viewer, and BusyIndicator controls.

Advanced Controls for Xamarin.iOS with Syncfusion

  • The Xamarin Show presentation, featuring the Kanban and Diagram controls.

Guest Blog: Mobile App Onboarding

  • Building a Xamarin app including a wide variety of controls.

Localization Made Easy

  • A blog walkthrough with resources for getting started and laying out your app.

Create a Scheduling Application Using Scheduler

  • Step-by-step blog post to design an app similar to a native device calendar.

Develop Xamarin Apps to Monitor Device Internals

  • Webinar recording incorporating Bluetooth, Wi-Fi, GPS, and Accelerometer data into your app.

Put OpenStreetMap, Bing Maps in Your App Using Syncfusion Maps

  • View sample code and a demo app for building online maps into your projects.

Develop Xamarin Apps Using the List View and Diagram Controls

  • Webinar recording showing how to kick-start an app with just these two tools.


Let us know in the comments section below if you’d like us to create any other blog posts or videos showing you how to use our Xamarin controls. If you’d like to play around with some of our 130 controls, we offer a free, 30-day trial so you can check them all out.

Viewing all 473 articles
Browse latest View live